
Figure 2.
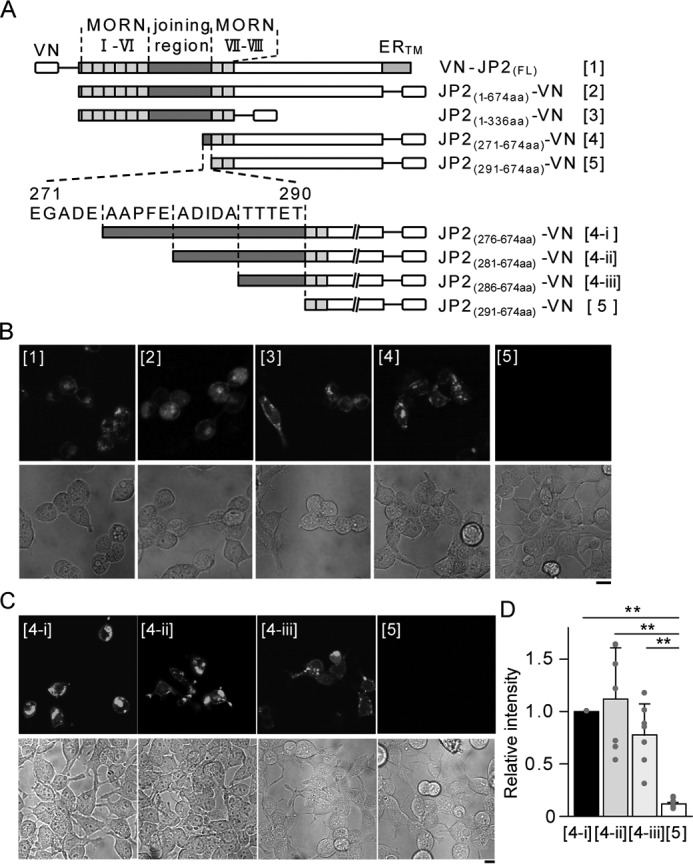
Essential binding sites of JP2 for the interaction with Cav1. A, the JP2 truncation constructs ([1] to [5]) used in the present study are shown. MORN motifs, the joining regions, and ER transmembrane domains (ERTM) are indicated. B and C, a series of representative confocal images of the BiFC assay. Fluorescent signals in the top panels indicate the complementation of VN and VC. Corresponding transmitted light images are shown in the bottom. Representative images from three independent experiments are shown. D, the fluorescence intensity of complimented Venus within regions of interest (ROI) in each image was divided by that of the Hoechst signal. The Venus/Hoechst ratio of the mutants ([4-ii], [4-iii], and [5]) was normalized to that of JP2(276–674aa)-VN ([4-i]). Seven sets of images ([4-i], [4-ii], [4-iii], and [5]) were acquired from three independent experiments in epifluorescent fields. *, p < 0.05; **, p < 0.01; one-way ANOVA followed by Tukey's test. Scale bars indicate 10 μm (B and C).