Figure 4.
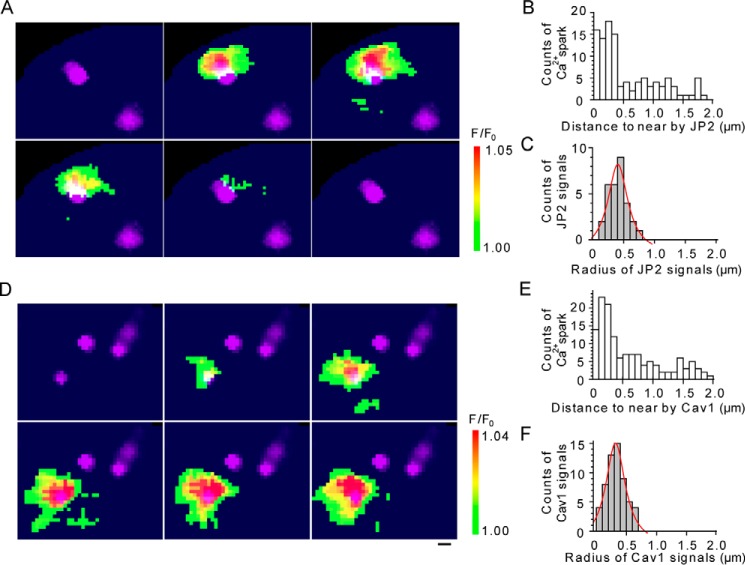
TIRF images of Ca2+ sparks and those of JP2 or Cav1 in mMASMCs. A and D, Ca2+ sparks in 40 mm [K+]o were detected with fluo-4/AM using a TIRF microscope. Continuous TIRF images of Ca2+ sparks were obtained at 27.2-ms intervals. Ca2+-spark images were merged with those of mCherry-JP2 or mCherry-cav1 (purple), which were separately recorded in the same cells. B and E, the distance from the center of a Ca2+-spark site to the center of the nearest mCherry-JP2 or mCherry-cav1 particles were measured. The number of observed sparks versus the distance is demonstrated in the distribution histogram (108 sparks from 12 mCherry-JP2-expressing cells, cav1; 146 sparks from 15 mCherry-cav1-expressing cells). C and F, the radii of mCherry-JP2 or mCherry-cav1 particles located closest to Ca2+-spark sites were measured (30 mCherry-JP2 particles, 59 mCherry-cav1 particles). The distribution histogram of radii is demonstrated and fit by the Lorenz function (red curves). Scale bars indicate 500 nm (A and D).

