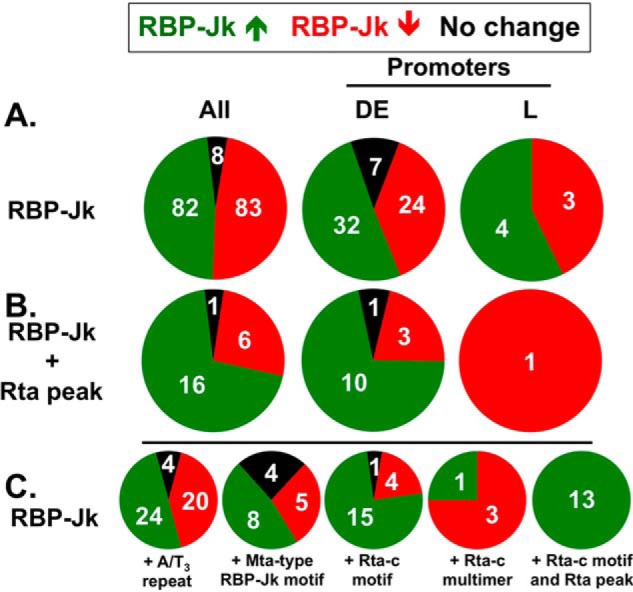
Figure 4.

Fraction of RBP-Jκ peaks mapped to DE or L promoters, co-located with Rta peaks and with Mta promoter motifs during latency and reactivation. Green segments represent RBP-Jκ peaks that increase in reactivation; red segments represent RBP-Jκ peaks that decrease in reactivation, and black segments are peaks that are unchanged in reactivation. Numbers of peaks in each category are indicated. A, proportions of all RBP-Jκ peaks in each category and those in DE or L promoters. B, same as A, but showing only the subset of RBP-Jκ peaks with co-localized Rta peaks. C, same as A, but showing subsets of RBP-Jκ peaks associated with each motif and/or Rta peak, as indicated.
