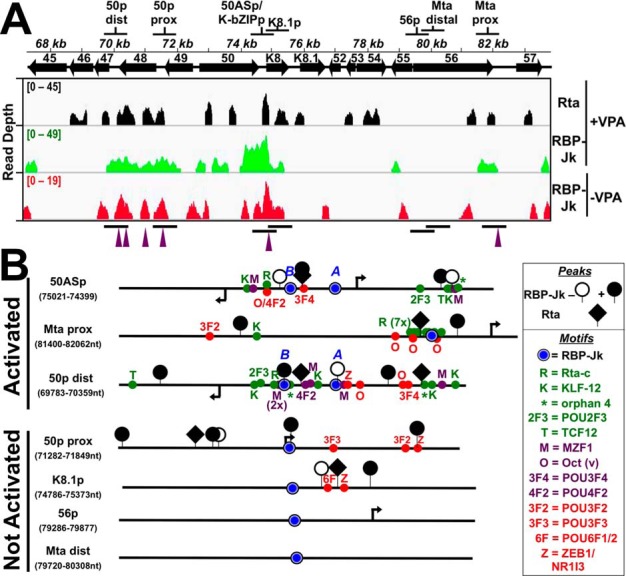
Figure 6.

Candidate promoter segments selected from ChIP experiments. A, genomic locations. Top shows the name and location of each segment. Bottom shows the visualization of ChIP/Seq peaks using IGV (85). Antibodies used are indicated at right, and chromatin was from latent (−VPA) or reactivated (+VPA) virus in BC-3 cells. Solid arrows represent open reading frames (ORFs). Numbering above arrows indicates ORF name. Peak heights are given in read depth per genomic position. Purple arrowheads below each panel indicate co-localized Rta and RBP-Jκ peaks in reactivation. B, portions of candidate promoters. Schematics representing portions of candidate promoters containing RBP-Jκ motifs and RBP-Jκ peaks are shown. The names of each promoter and the boundaries of schematics are indicated at left. The boxed legend explains the symbols. Arrows indicate positions of transcription start sites mapped to the viral genome within each candidate promoter. Motif text colors are as follows: red = over-represented at RBP-Jκ latency peaks; green = over-represented at RBP-Jκ reactivation peaks; purple = motif over-represented at coincident RBP-Jk/Rta peaks. Activated and nonactivated refer to results of Rta transactivation shown in Fig. 7.
