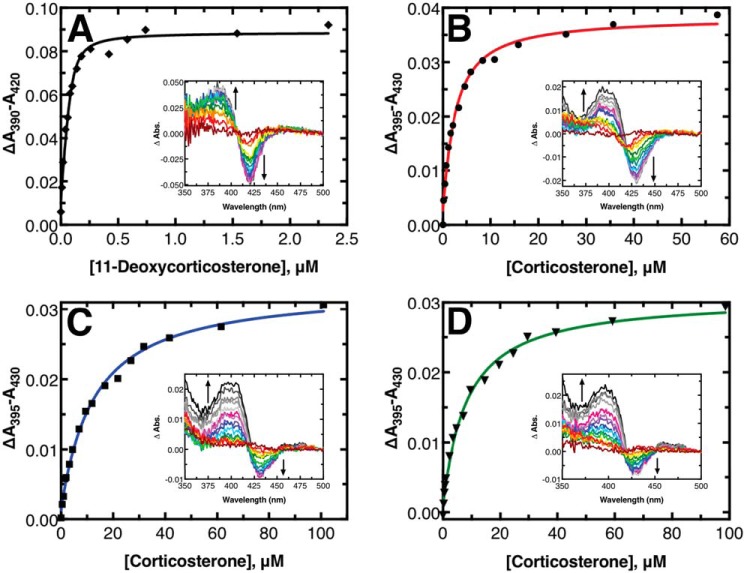
Figure 6.
Equilibrium titrations of substrates and products binding to P450 11B2. A, titration of 11-deoxycorticosterone into 0.1 μm P450 11B2 in a 10-cm pathlength cell. B, titration of corticosterone into 1 μm P450 11B2 in a 1-cm cell. C, titration of corticosterone into 1 μm P450 11B2 premixed with 150 μm 18-OH corticosterone in a 1-cm cell. D, titration of corticosterone into 1 μm P450 11B2 premixed with 200 μm aldosterone in a 1-cm cell. The solid lines are fits to a quadratic binding equation. The insets in each panel show the difference spectra between a sample with titrant added and a sample with no titrant added at each point indicated in the main panels.

