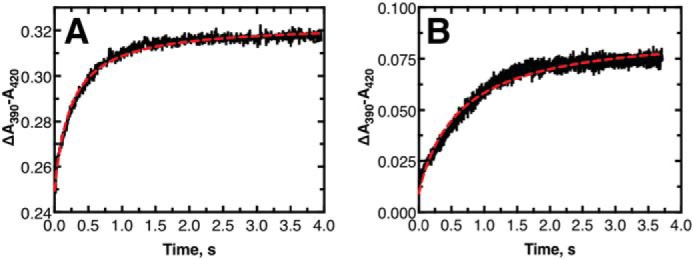
Figure 7.

Stopped-flow mixing transients of substrates mixing with P450 11B2. Both panels show the mixing of 1 μm P450 11B2 and 1 μm substrate (final concentrations): A, 11-deoxycorticosterone; B, corticosterone. The red dashed line in each panel is a nonlinear regression fit to the data. See text for more information regarding the fits.
