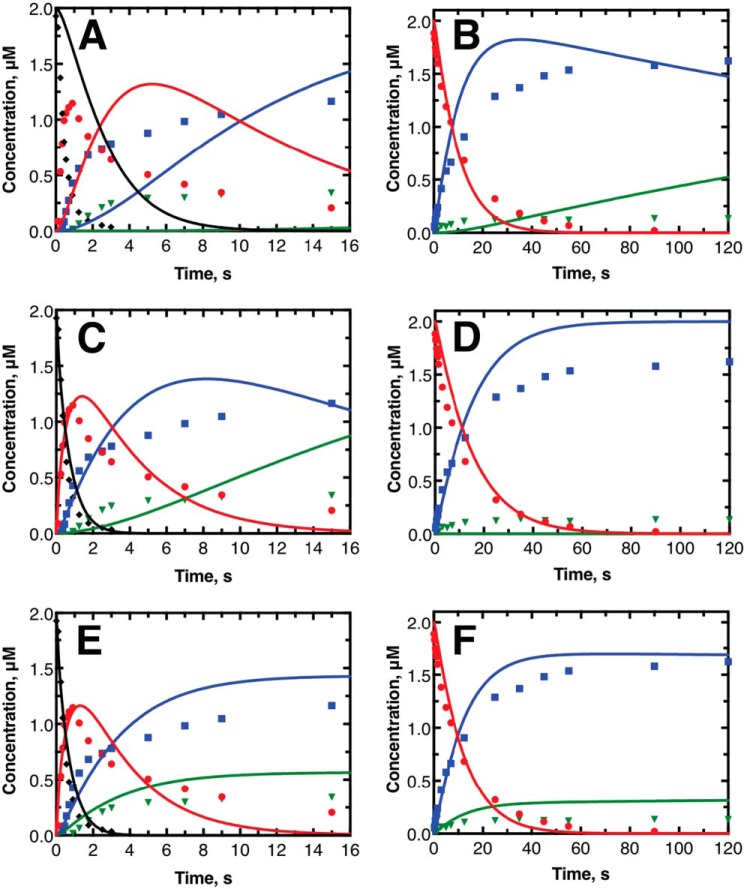
Figure 9.
Results of kinetic modeling to explain pre-steady–state results. Graphs shown display the same data as in Fig. 3 with the same point shapes and coloring. A, C, and E display the experimental pre-steady–state data starting with 11-deoxycorticosterone as the initial substrate as points. B, D, and F display the experimental pre-steady–state data starting with corticosterone as the initial substrate as points. The lines in each panel represent the expected reaction based on kinetic modeling done with KinTek Explorer. The lines shown in A and B are direct extrapolations of steady-state reaction data and equilibrium titrations. The lines in C and D use the same model as A and B but with optimized fit constants to the catalytic rate constants only. The lines in E and F come from introducing the lactol form of 18-OH corticosterone as a possible state. Kinetic fitting in C and E were performed separately from the fitting in D and F. See text for more information on modeling approach.

