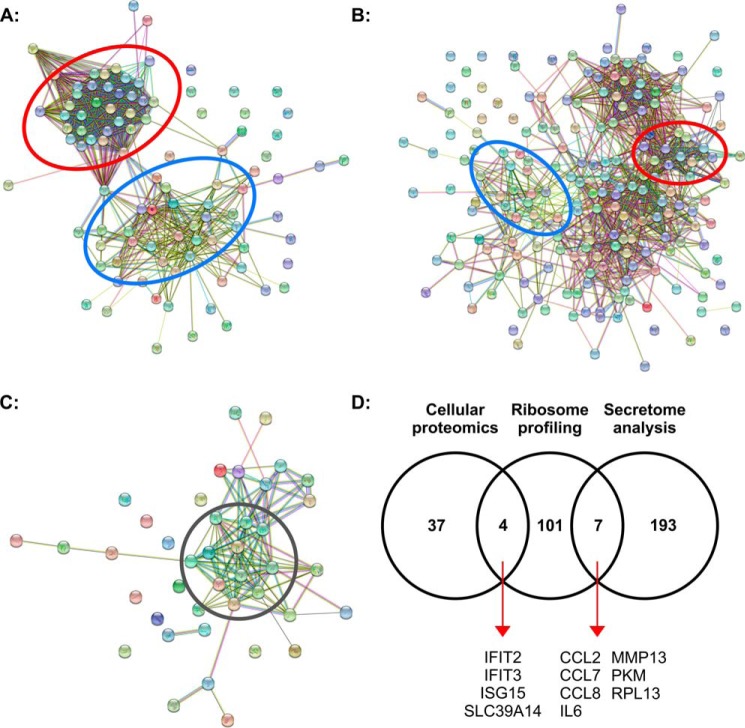
Figure 2.
SW1353 transcript/proteomic analyses. A, STRING analysis of the 112 transcripts of statistically significant differentially translated RPFs from the 3-h ±IL-1β treatment. B and C, STRING analysis of the 200 statistically significant differentially secreted proteins from the 24-h ±IL-1β treatment (B) and the 41 statistically significant differentially expressed proteins identified in the cell-layer proteomic analysis (C). D, Venn diagram showing the relationship of the top 200 transcripts/proteins identified through cellular proteomic analysis, ribosome profiling, and secretome analysis. Red circles highlight clustering of ribosome-associated transcripts/proteins, and blue circles highlight clustering of inflammatory-associated transcripts/proteins. The gray circle highlights interferon-associated proteins. A full list of transcripts/proteins and the STRING networks with labels can be found in the supporting information tables.

