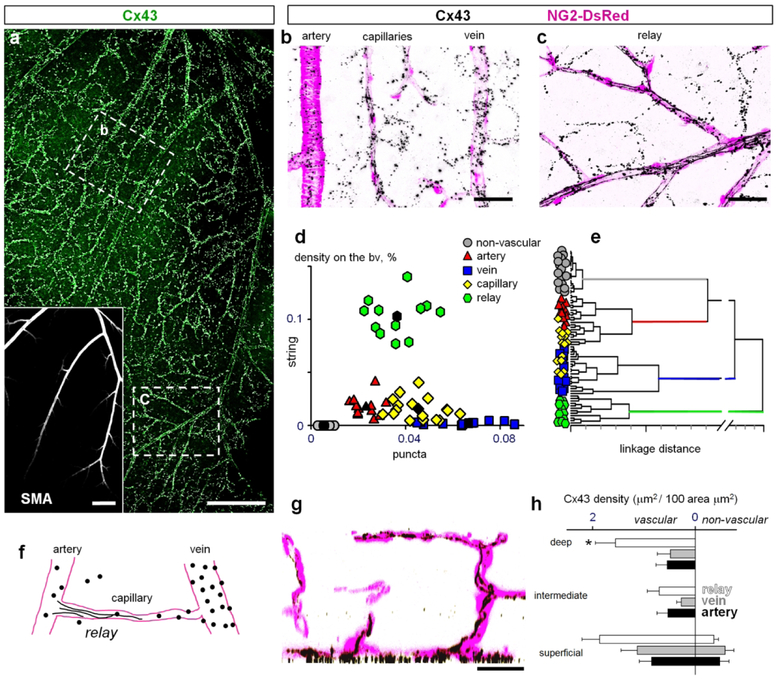
Figure 4. Hierarchy within the vascular tree dictates distinct patterns of Cx43 clustering.
(a) Cx43 is highly concentrated along retinal vasculature. Inset shows the arteries from the same area labeled for smooth muscle actin (SMA). Scale bar 200 μm. (b) In the superficial layer from area b in (a), majority of puncta were associated with vasculature: arteries, veins and capillaries and lower number of similar size puncta were present outside of the blood vessels. Scale bar 50 μm. (c) In the branches of major arteries from an area similar to the area c in (a), string-like structures running along the blood vessels were found in addition to the puncta. Scale bar 50 μm. (d) Density of the Cx43 puncta was the highest on veins and capillaries. The strings were found predominantly in relay regions connecting artery with capillaries. Density of Cx43 puncta outside of the blood vessels was significantly lower and no strings were detected. (e) Dendrogram created by cluster analysis of data from (d). (f) Schematic presentation of Cx43 expression pattern in retinal vasculature. (g) In a vertical section through the retina (created by rotation of a thin slit from the z-stack), the string-like structures from the superficial layer were extending along some capillaries into the intermediate and deep vascular layers. Scale bar 50 μm. (h) Distribution of Cx43 shows that Cx43 (puncta and strings combined) is predominantly expressed on the vasculature throughout the retina. The relays have the highest densities of Cx43-positive structures. The intermediate and deep layer capillaries above these relay zones also have the highest expression of Cx43 in string-like structures. The non-vascular expression in the superficial layer reflects the puncta outside of the blood vessels; no puncta of the same size and labeling intensity was detected in the intermediate and deep layers. Data are shown as average ± SD; arteries, vein and transitions were quantified in 6 samples from 6 mice; capillaries and non-vascular areas in n = 12 samples from n = 6 mice. ANOVA on ranks, * p = 0.0001.

