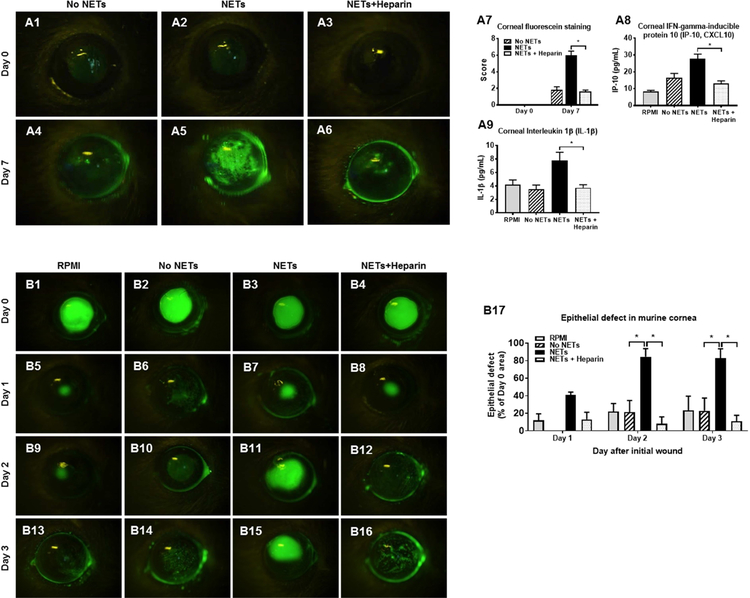
Figure 5. Pathological effects of NETs on murine ocular surface.
(A1-A6): Representative images of murine corneas (n=5/group) showing fluorescein staining after topical application of unstimulated murine neutrophils supernatant (no NETs), PMA stimulated murine neutrophils (naive NETs), and heparinized murine NETs (dismantled NETs). (A7): Graph comparing fluorescein staining data between groups at Day 0 and Day 7. (A8): Graph showing amount of IP-10 in corneal lysates prepared after 7 days of topical application of RPMI (n=12 corneas), no NETs (n=12 corneas), NETs (n=12 corneas), and heparinized NETs (n=27 corneas). (A9): Graph showing amount of IL-1β in corneal lysates prepared after 7 days of topical application of RPMI (n=12 corneas), no NETs (n=12 corneas), NETs (n=24 corneas) and heparinized NETs (n=15 corneas). (B1-B16): Representative images of murine corneas showing fluorescein staining after epithelial scratch and application of RPMI culture medium, unstimulated murine neutrophils supernatant (no NETs), PMA-stimulated murine neutrophils (naïve NETs), and heparinized murine NETs (dismantled NETs). (B17): Graph comparing the epithelial defect area between groups at Day 1 to Day 3 (n=5/group).

