
Figure 1. Reorganization of TADs during human cardiomyocyte differentiation.
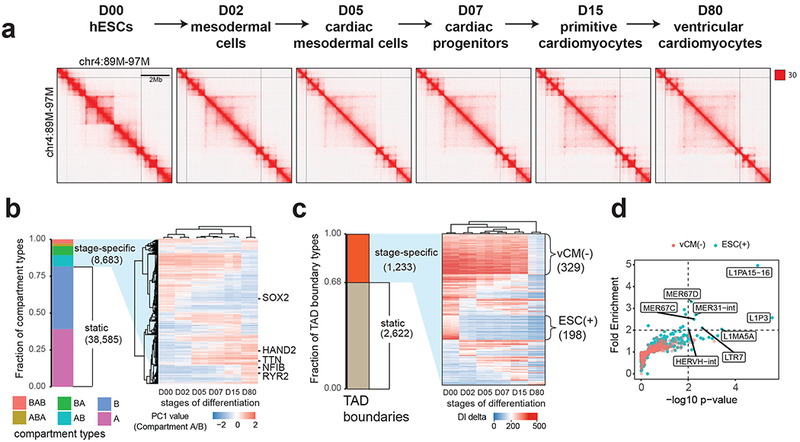
(a) Hi-C contact matrices for each stage of cardiomyocyte differentiation at mega-base resolution. (b) A heatmap showing hierarchical clustering of dynamic chromatin compartments during cardiomyocyte differentiation. The pseudo-color reflects the PC1 values (compartment A/B) of compartment bins. Negative PC1 value stands for compartment B and positive for compartment A. Representative genes located in corresponding compartment bins are annotated to the right of the heatmap. (c) A heatmap showing the DI delta scores for the stage-specific TAD boundaries, ordered by the presence of TADs at six stages. vCM(−) stands for TAD boundaries lost in purified ventricular cardiomyocytes at D80, ESC(+) stands for hESC-specific TAD boundaries. (d) Scatter plot shows the fold enrichment and −log10(P values) for various repeat element classes at ESC(+) (N = 198) and vCM(−) (N = 329) TAD boundaries relative to the static TAD boundaries (N = 2,622). P values are from two-sided proportion test.