
Figure 3. Deletion of two HERV-H sequences leads to merging of TADs in hESCs.
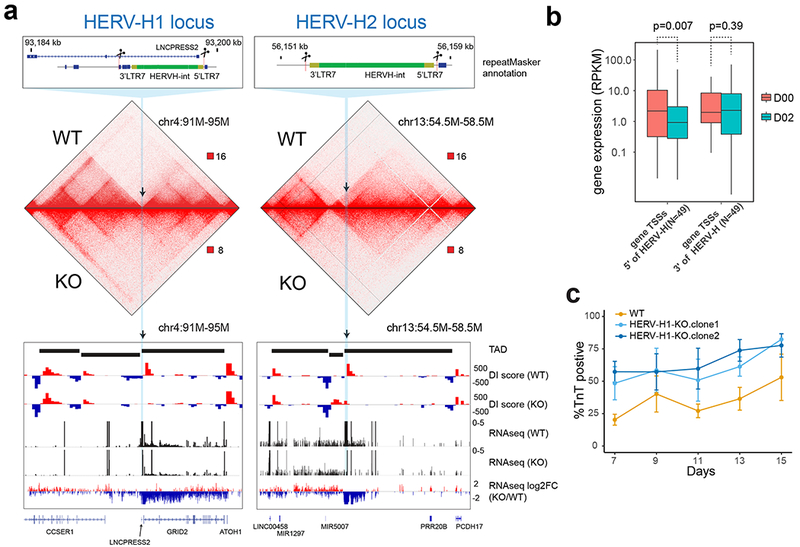
(a) Hi-C interaction matrices of the wild-type (WT) and transgenic hESC lines (HERV-H1-KO and HERV-H2-KO) are shown, along with DI scores, expression levels (RPKM) and fold changes of gene expression at the HERV-H1 and HERV-H2 loci. The loss of TAD boundary in the transgenic cells is accompanied with decrease of RNA expression of genes 5’ terminus to the HERV-H sequences. (b) Boxplots show expression levels (RPKMs) of genes whose TSSs are located from −500 kb to the 5’ LTR (N = 49) and from 3’ LTR to +500 kb (N = 49) of boundary-associated HERV-Hs. P values are from two-sided paired t test on the log-transformed expression levels. The elements of the boxplot are: center line, median; box limit, upper and lower quartiles; whiskers, 1.5× interquartile range. (c) Line chart (mean ± standard error, N = 3 cardiomyocyte differentiations) shows percentage of TNNT2 positive cells during cardiomyocyte differentiation of WT and HERV-H1-KO hESC lines (two HERV-H1-KO clones analyzed). HERV-H1-KO hESCs display increased cardiomyocyte differentiation efficiency compared to WT hESCs.