
Figure 6. HERV-H introduces new TAD boundaries during primate evolution.
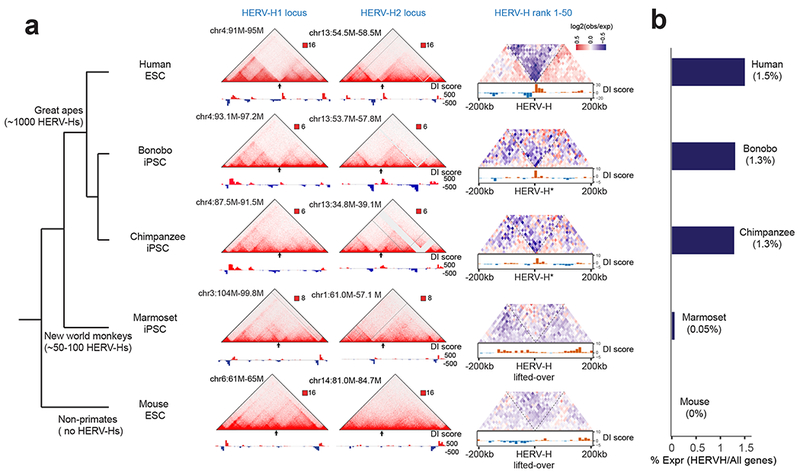
(a) A simplified tree of primate evolution with the copies of HERV-H annotated (left) and Hi-C interaction matrices of human ESCs, bonobo iPSCs, chimpanzee iPSCs, marmoset iPSCs and mouse ESCs are shown, along with DI scores at the syntenic regions to human HERV-H1 locus, HERV-H2 locus, and all top 50 transcribing HERV-Hs. The chimpanzee and bonobo syntenic regions are denoted with a star as they also contain HERV-H sequence. (b) Bar chart shows the percentage of HERV-H transcripts over all transcripts in the PSCs from each indicated species.