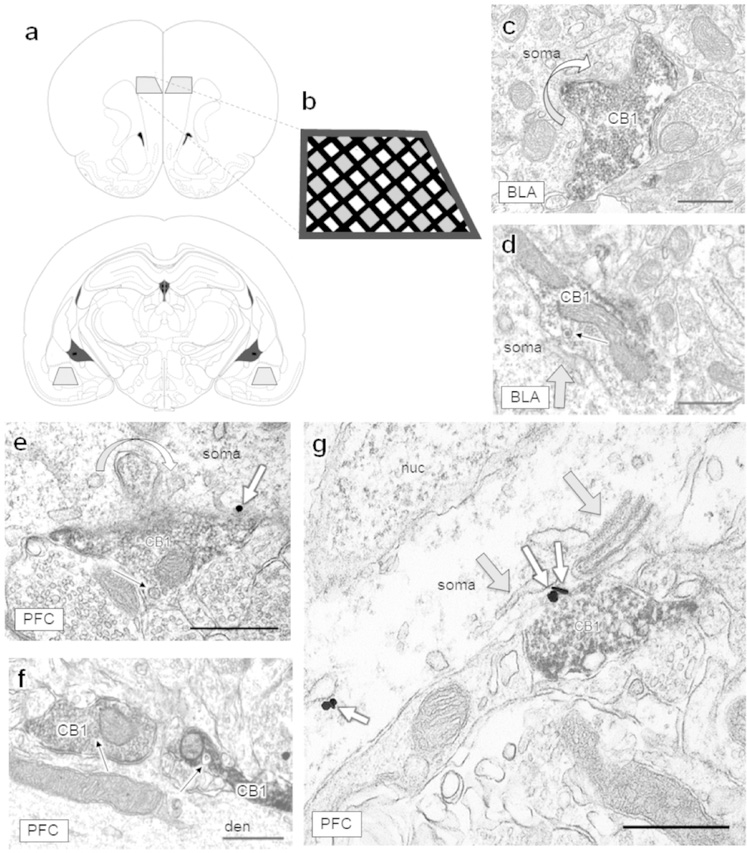
Figure 1: Neuronal regions selected for single-section analysis and morphological features of CB1-containing axon terminals.
(a) Grey trapezoids represent the regions examined. The prelimbic region of the PFC (top) and the basolateral region of the amygdala (bottom) were sampled bilaterally. Images adapted from Paxinos and Watson, 1997. (b) Black lines represent the grid bars of the copper grid and grey shaded regions represent areas where micrographs were typically captured. The PFC was sampled throughout layers II-V/VI. CB1 immunoreactive axon terminals were very rarely present in layer I but were abundant throughout all other layers. (c-d) CB1-containing axon terminals contact neuronal somata in the BLA and (e-g) somata and large dendrites in the PFC. (c) A curved arrow shows a CB1-containing axon terminal protruding into a neuronal soma in the BLA and (e) in the PFC, creating increased surface area between CB1-containing terminals and postsynaptic targets, which sometimes contained mGluR5 immunogold (small white arrows). Dense core vesicles (narrow black arrows) are often visible within CB1 axon terminals of the BLA (d) and PFC (e-f). (g) Folds of endomembranes (grey arrows; also in d) were often observed adjacent to CB1-containing terminals. CB1 = CB1-containing axon terminal, den = dendrite, nuc = nucleus. Scale bars = 500 nm.

