Table 1:
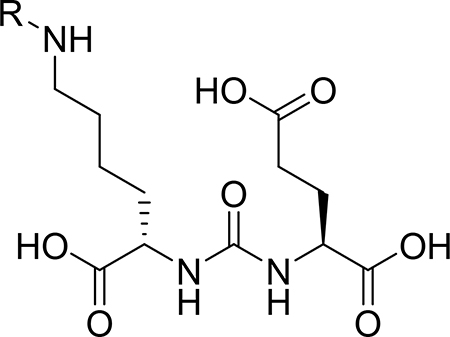 | |||||
|---|---|---|---|---|---|
| Entry | R | IC50 (nM) | Entry | R | IC50 (nM) |
| 1a | 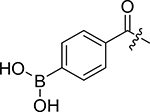 |
130.3±28.9 | 1f | 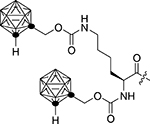 |
555.5±79.3 |
| 1b | 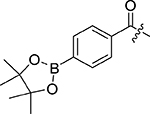 |
318.4±21.1 | 1g | 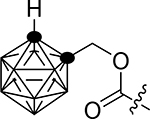 |
45.7±6.7 |
| 1c | 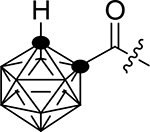 |
363.8±8.7 | 1h | 128.0±8.4 | |
| 1d | 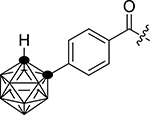 |
20.3±2.4 | control | 2-PMPA | 523.5±84.0 |
| 1e |  |
536.8±58.7 | |||
Cell line in all cases is 22Rv1.
The competitive binding compound is 68Ga-PSMA-11.
Cells were plated 48 h before testing (in triplicate). Various concentration (0.01–100000 nM) of compounds with 10 μCi of 68Ga-PSMA-11 were added to cells and incubated for 1h. Cells were washed and lysed. A gamma counter was used to measure the bound fraction to the lysed cells.
