Figure. 2.
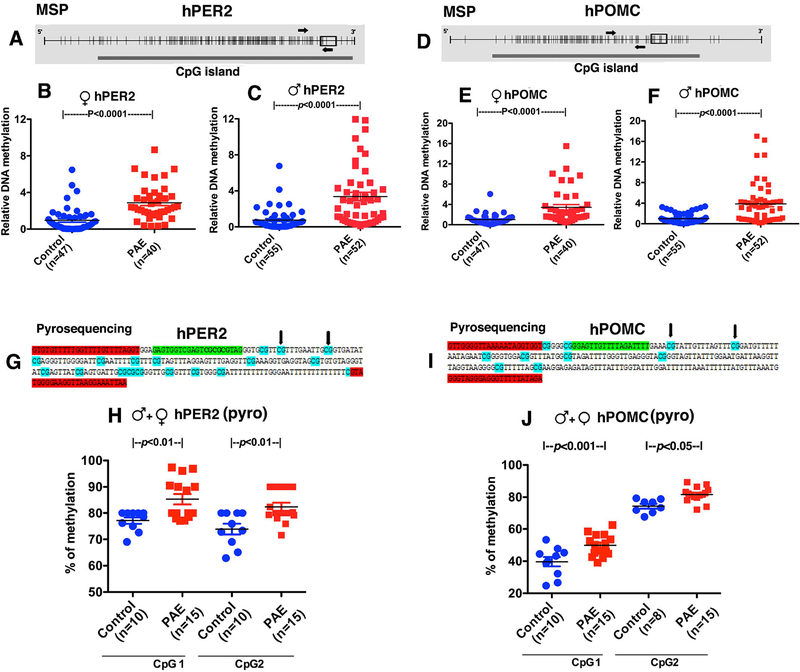
Changes in PER2 and POMC gene methylation as determined by methylation specific RT-PCR (MSP) (A-F) and pyrosequencing (G, J) in children with PAE. A-F. Schematic diagrams representing hPER2 and hPOMC promoter CpG islands are shown in Fig. 2A and 2D. Each small vertical line represents a single CpG. The thick solid bar below represents a CpG island. Small rectangular open box shows the location of exon1 in the sequence. MSP primers were represented with arrows covering about 15 CpGs for PER2 in Fig. 2A and 9 CpGs for POMC in Fig. 2D. Gene methylation changes in salivary DNA samples were evaluated by first by MSP in male and female children 5–18 years old with prenatal alcohol exposed (PAE) and controls; female patients PER2 (B) and POMC (E), male patients PER2 (C) and POMC (F). Some of the same samples from male and female PAE and control children were assayed by pyrosequencing for determination of methylation changes at two CpG sites of PER2 (H) and POMC (J). Schematic diagrams representing hPER2 (A), hPOMC (D) promoter CpG islands targeted in pyrosequencing assays. The pyrosequencing primers were designed to target two different CpGs for PER2 (G) and two for POMC (I). Bisulfite sequencing primers used were highlighted in red. Sequencing primer is highlighted in light green. Each CpG in the sequence is highlighted in turquoise. The two CpGs whose methylation measured was represented with black arrow. Differences between groups are shown by lines with p values on the top of bar graphs.

