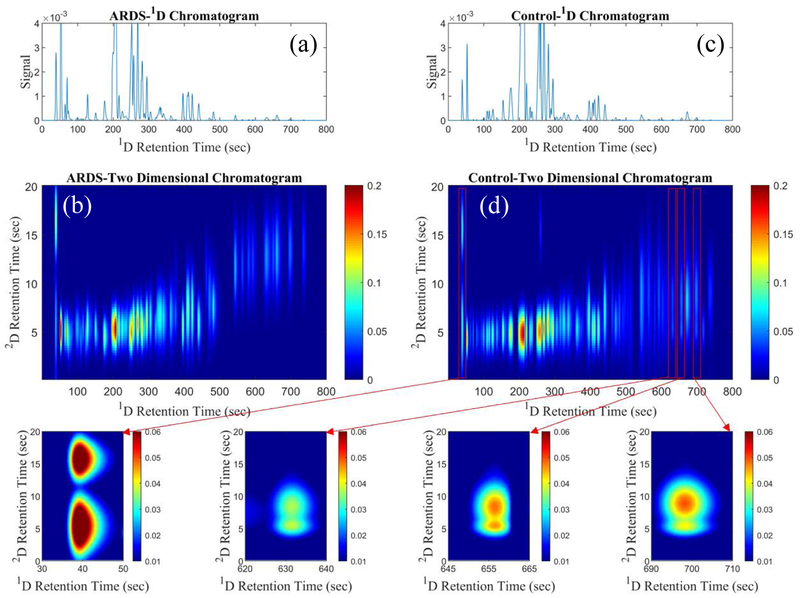
Fig. 4.
(a) and (b) Representative 1D chromatogram and 2D chromatogram for an ARDS patient, respectively. (c) and (d) Representative 1D chromatogram and 2D chromatogram for a non-ARDS (control) patient, respectively. In the zoomed-in 2D chromatogram for the control patient, four co-eluted 1D peaks are separated into eight peaks in the 2D chromatogram. Other zoomed-in portions of (b) and (d) can be found in ESM Fig. S1

