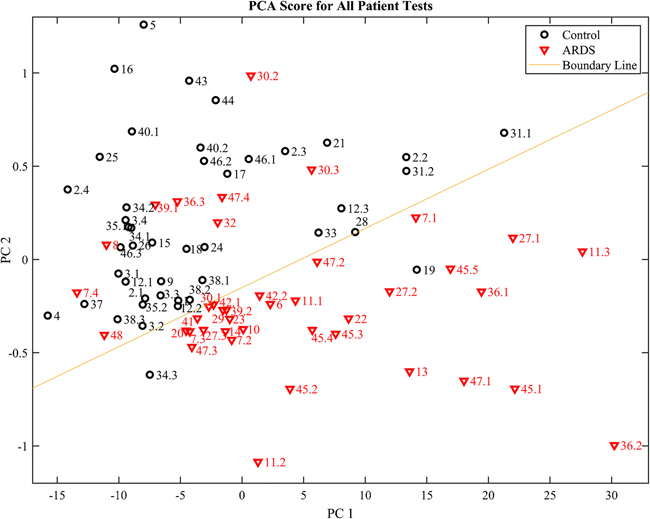
Fig. 7.
PCA plot of all recruited patients. X-axis (PC 1) is the 1st principal component and Y-axis (PC 2) is the 2nd principal component. The red and black symbols denote respectively the ARDS and non-ARDS patients adjudicated by physicians using the Berlin criteria. The patient numbers are given by the symbol. For example, “11.1” and “11.3” denote Patient #11, Day 1 and Day 3 results, respectively. The bottom/top zone below/above the boundary line represents respectively the ARDS/non-ARDS region using the breath analysis method. The corresponding Q-residuals for this PCA model are shown in ESM Fig. S5

