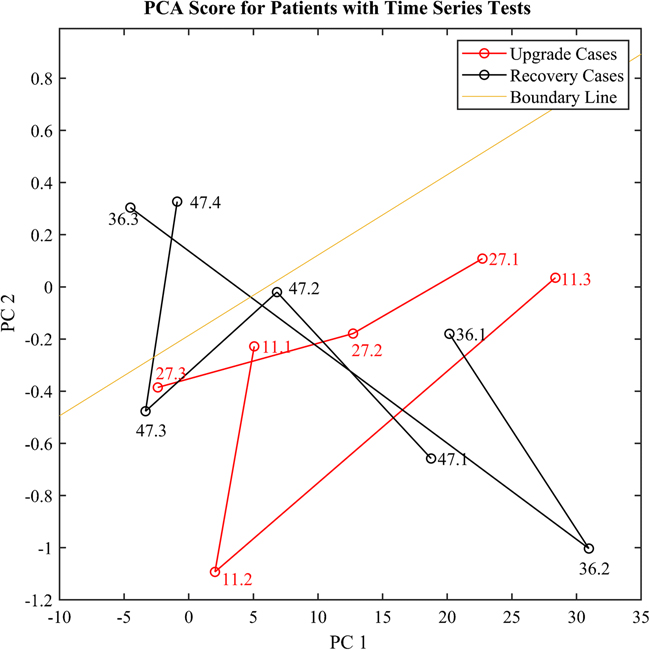
Fig. 8.
The trajectory on PCA plot for patient #11, #27, #36, and #47. #11 and #27 are the upgrade case (initially listed as potential ARDS on the first day) and #36 and #47 are recovery cases (extubated and discharged from ICU 24–48 hours after the last test). The bottom/top zone below/above the boundary line represents respectively the ARDS/non-ARDS region using the breath analysis method
Note: If the breath test results do not match the clinical adjudication, we consider the test as “misclassification” when calculating the overall classification accuracy, even for the cases like #36.3 and #47.4 that suggest that the breath analysis was able to predict the trajectory of ARDS (i.e., earlier diagnosis).

