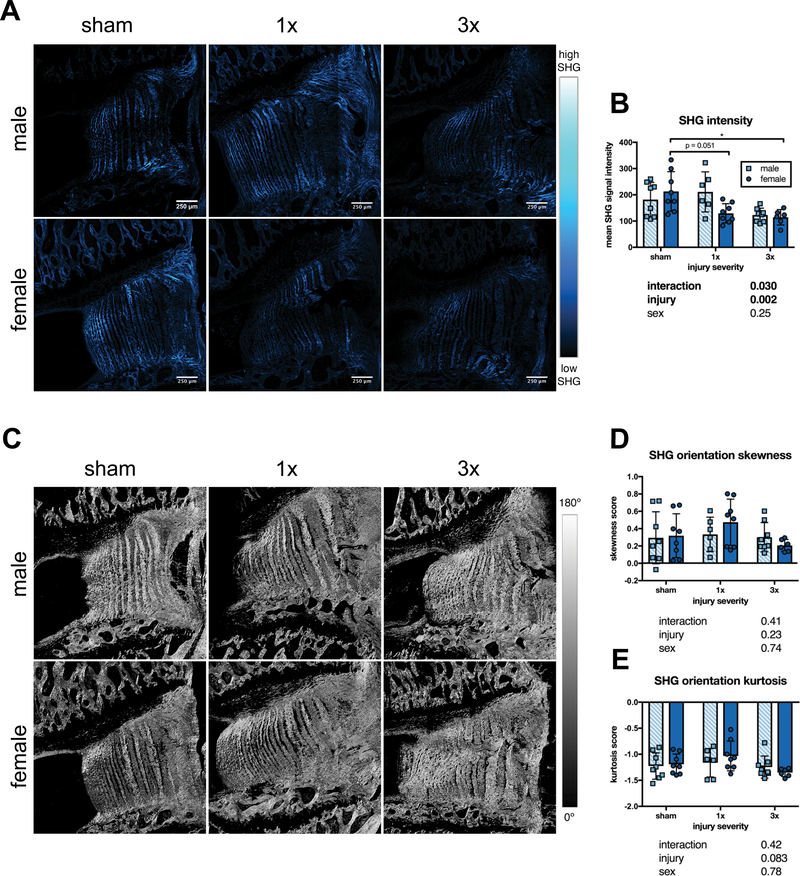
Figure 8. SHG signal intensity was reduced after injury only in female IVDs.
(A) Representative SHG images. (B) SHG signal mean intensity was reduced in both 1x and 3x in female, but not male IVDs. (C) Representative images of fibril orientation distribution generated using Orientation J. (D) Skewness of fibril orientation histograms did not differ between groups. (E) Kurtosis of orientation histograms did not differ between groups (n=6–8, * p < 0.05, p values for 2-way ANOVA effects shown below each graph).

