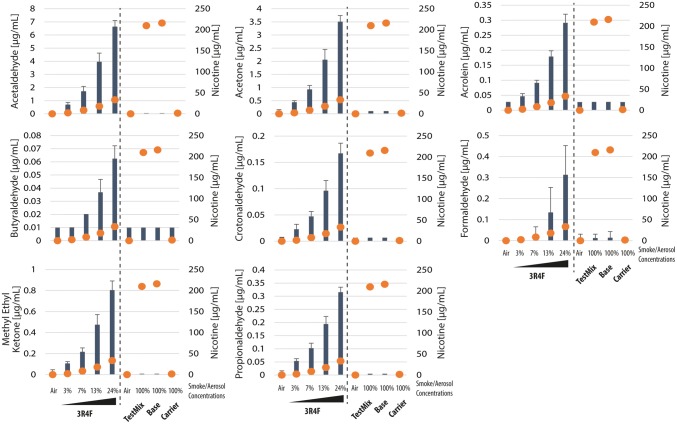
Fig. 3.
Concentrations of deposited carbonyls and nicotine in the exposure chamber. Shown are the mean and standard deviation of concentrations of deposited carbonyl compounds (left y-axis) after a 112-puff exposure to 3R4F cigarette smoke or test mix, base, or carrier aerosols at the indicated concentrations (x-axis). The orange dots indicate the median concentrations of nicotine deposited in the exposure chamber (right y-axis; given in Table 4)

