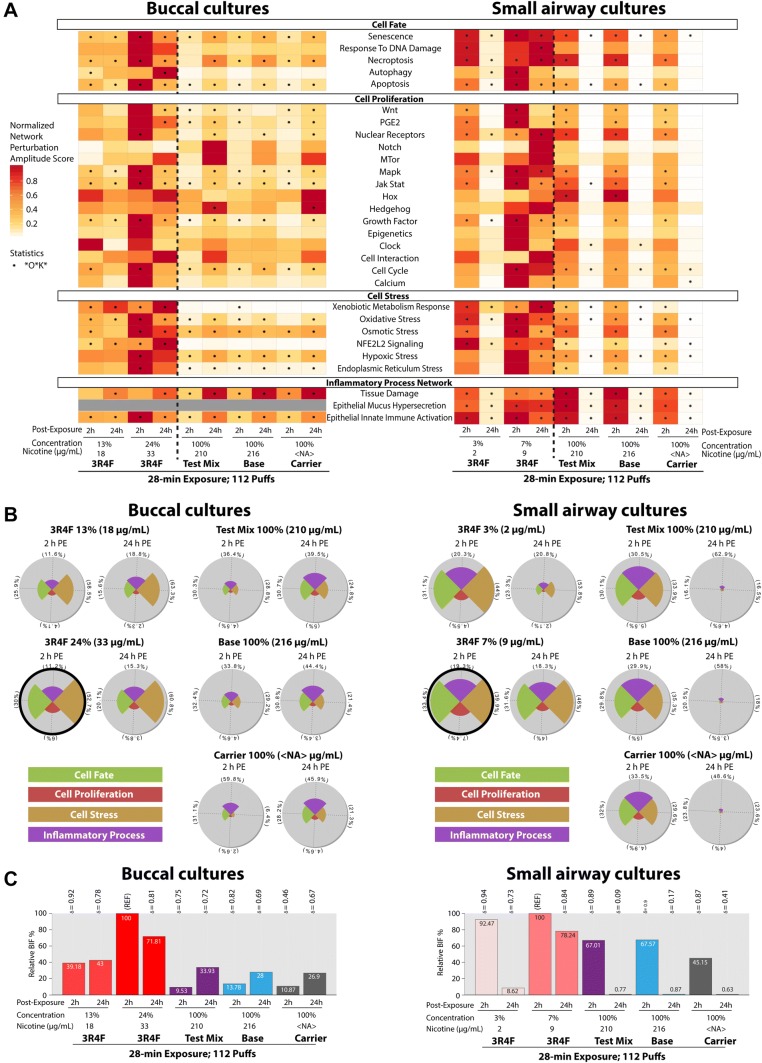
Fig. 8.
Causal network enrichment approach for the analysis of transcriptome data. a Perturbation scores for each network and treatment group. b Star plots showing the relative biological impact factor of each network family. Star plots circled in thick black lines had the highest impact factor. The slice of the plot, which is also marked in percentages, refers to its relative contribution to the overall biological impact factor (BIF, shown in c). c The relative BIF scores were normalized to the maximum impact score (marked “REF”). PE post-exposure; NA not applicable

