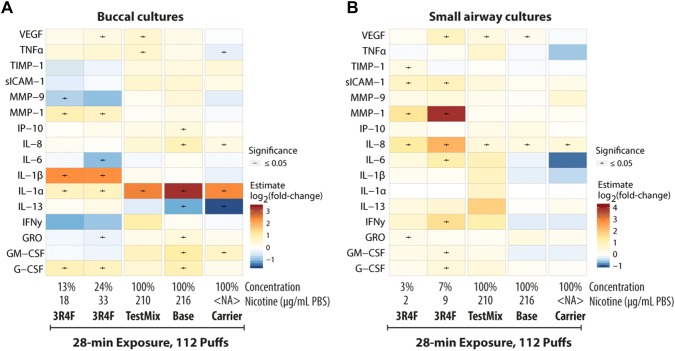
Fig. 9.
Changes in inflammatory mediator concentrations in the culture medium following exposure. Heat map color indicates the log2(fold-change) of the concentrations of mediators in the medium of buccal (a) and small airway (b) cultures exposed to 3R4F cigarette smoke or test mix, base, or carrier aerosols over concentrations in air-exposed samples. NA not applicable; PBS phosphate-buffered saline. Boxplot representations of the buccal and small airway data are reported in Supplementary Fig 2 and Supplementary Fig 3, respectively

