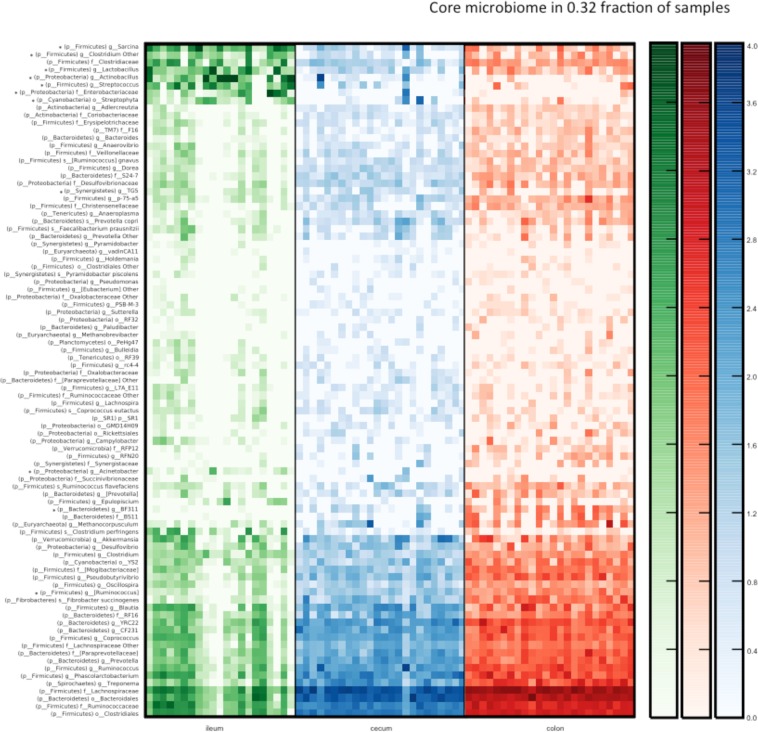
Figure 2.
Heatmap illustrating a core microbiome (taxa represented in at least 32% of all samples) characterized with amplicon sequencing of 16S rRNA gene (V3-V4 region) within three sections of horse gastrointestinal tract. *Indicates taxa with significantly shifted abundance between the three sections (ANCOM, FDR p < 0.05). No major differences in the taxa abundance were detected between the colon and cecum microbiota composition. Scale on the right indicate log abundance.

