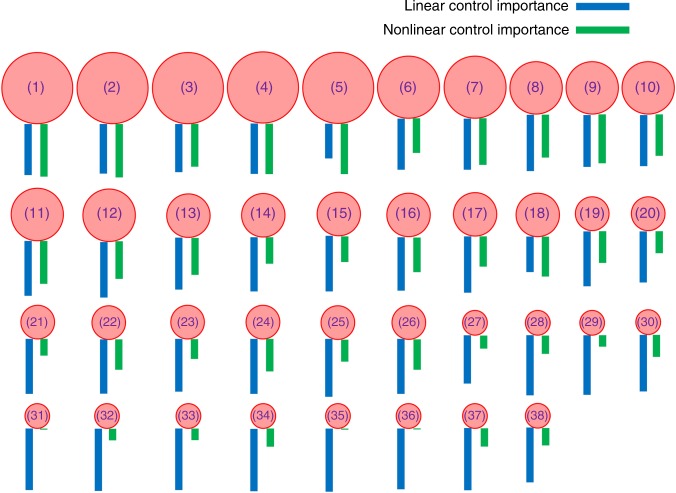
Fig. 1.
Distinct characteristics in nonlinear and linear control of a representative complex mutualistic network. The system is network A reconstructed based on empirical data from Tenerife, Canary Islands67. The numbers of pollinators, plants, and mutualistic links are NA = 38, NP = 11, and L = 106, respectively. For each node, the species name is given in Supplementary Table 1. The length of the green bar below each species is indicative of the relative importance of the node in tipping point control of the actual nonlinear dynamical network, which is calculated based on Eq. (1). The blue bars illustrate the relative importance of the nodes when the system is artificially treated as a linear, time-invariant network, which are calculated according to Eq. (7). There is great variation in the lengths of the green bars for different species, demonstrating a highly non-uniform nonlinear control importance ranking. In contrast, there is little variation in the length of the blue bars among the different species, indicating an approximately uniform linear control importance ranking. Linear controllability may thus not be useful for controlling the actual nonlinear dynamical network

