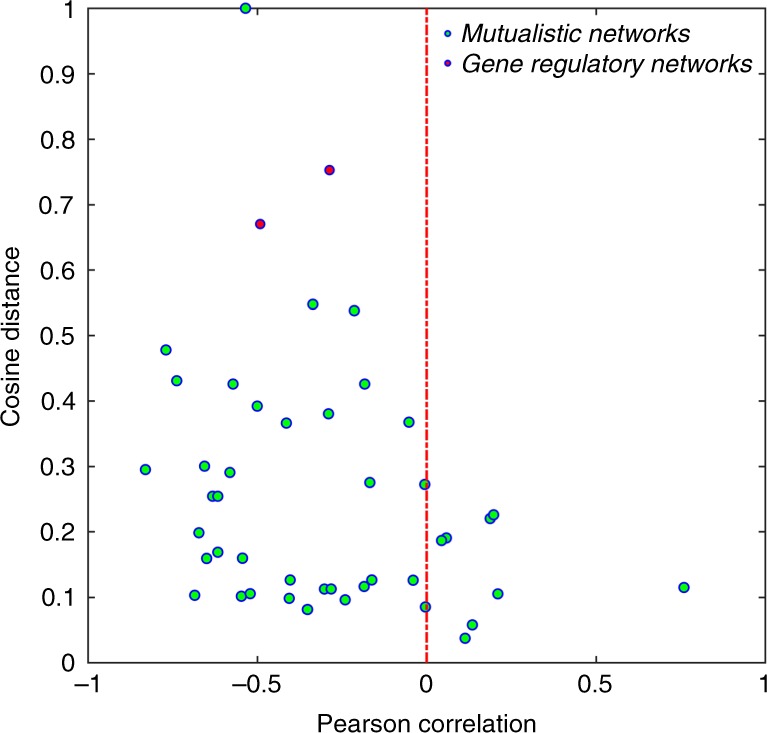
Fig. 5.

Pearson correlation and cosine distance between linear and nonlinear control importance. The abscissa and ordinate correspond to the values of Pearson correlation and cosine distance, respectively, between linear and nonlinear control importance. Each green circle corresponds to a real mutualistic network (there are 43 of them) and the two red dots are for the two gene regulatory subnetworks in Fig. 4. If there were a kind of relevance between nonlinear and linear control of the same network, the dots would concentrate in the lower right region of the plane with positive Pearson correlation and a small cosine distance. For most of the empirical networks tested, the dots are in the region of negative correlation with cosine distances below 0.4. For the two gene regulatory subnetworks, not only are the values of the Pearson correlation negative, the cosine distances are also large
