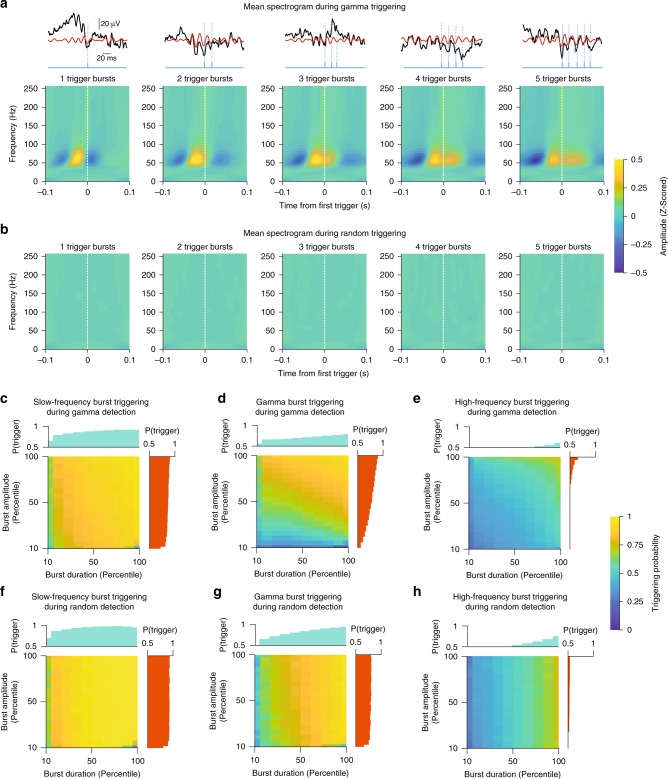
Fig. 4.
Gamma detection method shows frequency specificity and tracks the strength and duration of mid-gamma events. a Average BLA spectrograms around the first trigger generated by the gamma detection algorithm, for bursts containing different numbers of triggers (1-trigger to 5-trigger bursts, left to right). The first trigger of each burst is preceded by two above-threshold gamma cycles. Color bar: Z-scored spectral amplitude. Top: Example raw (black) and filtered (red) LFP traces for each burst size, along with trigger times (blue). b Similar spectrograms but during random triggering. c Probability of triggering within slow-frequency bursts (1–30 Hz) during mid-gamma detection, stratified by slow-frequency burst duration (x-axis) and amplitude (y-axis). Side bar graphs indicate marginal distributions for the corresponding dimension. Color bar: Triggering probability. d Probability of triggering within mid-gamma frequency bursts (40–70 Hz) during mid-gamma detection. e Probability of triggering within high-frequency bursts (90–250 Hz) during mid-gamma detection. f Probability of triggering within slow-frequency bursts (1–30 Hz) during random detection. g Probability of triggering within mid-gamma frequency bursts (40–70 Hz) during random detection. h Probability of triggering within high-frequency bursts (90–250 Hz) during random detection

