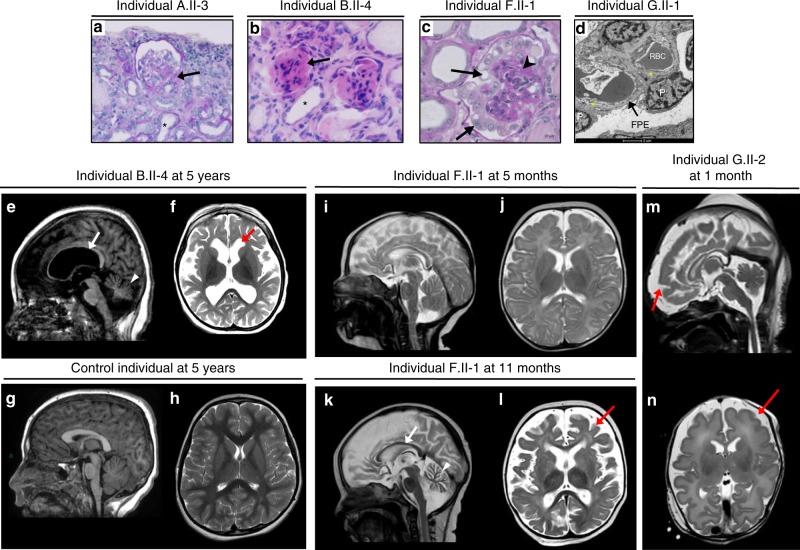
Fig. 2.
Kidney pathology analysis and neuroimaging. Light and transmission electron microscopy (TEM) of kidney sections of patients with GON7 (a, b) or YRDC mutations (c, d). a Individual A.II-3 displays a retracted glomerulus with a focal segmental glomerulosclerosis lesion at the vascular pole (black arrow) and tubular dilations (black star) (PAS; ×200 magnification). b Individual B.II-4 displays diffuse mesangial sclerosis with tiny, retracted and sclerosed glomeruli (black arrow) with dilated tubes surrounded by flat epithelial cells (black star) and interstitial fibrosis (H&E; ×400 magnification). c Individual F.II-1 displays a marked glomerular tuft collapsing (arrowhead) surrounded by a layer of enlarged and vacuolized podocytes (black arrows) (PAS stain; ×400 magnification, scale bar, 10 µm). d TEM of individual G.II-1 shows diffuse foot process effacement (FPE; black arrow), a classical hallmark of nephrotic syndrome, along a glomerular basement membrane (GBM) with abnormal folded and laminated segments (yellow stars), alternating with others with normal appearance. P podocyte, RBC red blood cell. Scale bar, 2 µm. Brain MRI of patients with GON7 (e, f) and YRDC mutations (i–n). e, f Brain MRI abnormalities in individual B.II-4 at 5 years. Sagittal T1-weighted image (e) shows important cortical subtentorial atrophy as well as corpus callosal (arrow) and cerebellar atrophy (arrowhead). The axial T2-weighted image (f) shows abnormal myelination and ventricular dilatation (red arrow). g, h Brain MRI of a 5-year old control showing sagittal T1 (g) and axial T2 (h) weighted images. i–l Brain MRI abnormalities in individual F.II-1 at 5 months (i, j) and 11 months (k, l). Sagittal T2-weighted image shows normal pattern at 5 months (i) evolving to a progressive major cerebellar (arrowhead) and cortical atrophy with a very thin corpus callosum (arrow) at 11 months (k). The axial T2-weighted image is normal at 5 months (j) but shows a very marked abnormality of myelination and cortical atrophy (red arrow) at 11 months (l). m, n Brain MRI abnormalities in individual G.II-2 at 1 month. Sagittal T2 (m) and axial T2 (n) weighted images show gyral anomalies with marked frontal gyral simplification (red arrow) and myelination delay

