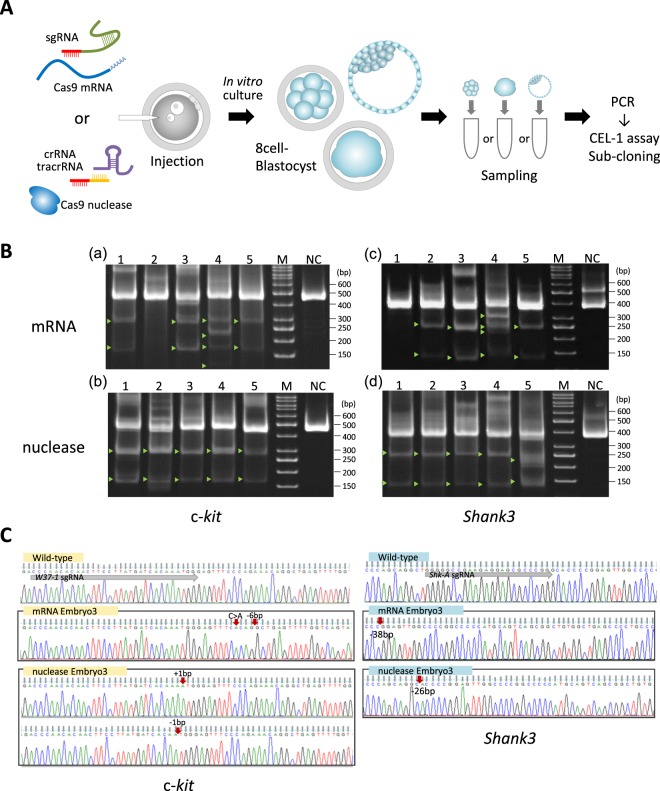
Figure 2.
Validation of CRISPR/Cas9 cleavage activity in marmoset embryo. (A) Flowchart of target gene modification validation using CRISPR/Cas9 injected whole embryos. The embryos were cultured in vitro, and collected into PCR tubes directly after zona pellucida removal. Subsequently, PCR was performed on the collected embryos. (B) A portion of the CEL-1 assay result using PCR product obtained from CRISPR/Cas9 injected embryos. Upper panels show the results of c-kit targeted CRISPR/mRNA (mRNA) injected embryos (a), and CRISPR/nuclease (nuclease) injected embryos (b). Lower panels show the results of Shank3 targeted CRISPR/Cas9 injected embryos (c,d). Lanes 1–5 in all panels contain Cel-1 nuclease digested DNA of PCR products obtained from each CRISPR/Cas9 injected embryo. M; size marker, NC; negative control – PCR product obtained using wild-type marmoset tissue as a PCR template. (C) Representative Sanger sequencing chromatograms of sub-clones derived from CRISPR/Cas9-injected embryos. Left panels show the results of sub-clones obtained from c-kit-targeted CRISPR/mRNA (mRNA Embryo3) or CRISPR/nuclease (nuclease Embryo3)-injected embryos. Right panels show the results of sub-clones obtained from Shank3-targeted CRISPR/Cas9-injected embryos (mRNA Embryo3 and nuclease Embryo3). This figure correlates with embryo samples listed in Supplemental Table 7 (c-kit) and 8 (Shank3). The top of each panel exhibits wild-type sequences of each target gene. Gray arrow; sgRNA sequence, red arrow; the position of indel or substitution mutations in each target gene.

