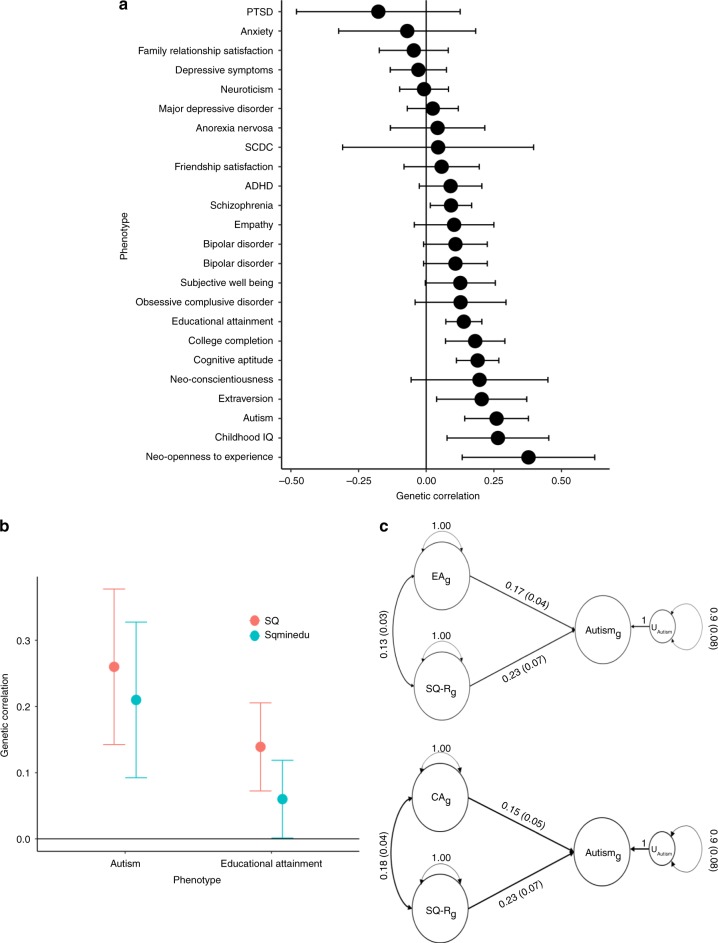
Fig. 3.
Genetic correlation between the SQ-R and other phenotypes, and GWIS and GSEM estimates between SQ, educational attainment and cognitive aptitude. a Genetic correlations between the SQ-R and multiple other phenotypes provided. The bars represent 95% confidence intervals. Sample sizes and PMID are provided in Supplementary Data 9. The following genetic correlations were significant after Bonferroni correction: autism (rg = 0.26 ± 0.06; P = 3.35 × 10⁻⁵, N = 46,350), years of schooling (rg = 0.13 ± 0.03; P = 4.73 × 10⁻⁵, N = 293,723), college completion (rg = 0.18 ± 0.05; P = 1.30 × 10⁻³, N = 95,427), and cognitive aptitude (rg = 0.19 ± 0.04; P = 2.35 × 10⁻⁵, N = 78,308). b Results of the GWIS analysis. Red lines represent genetic correlation with the SQ-R, blue lines represent genetic correlations with the SQ-R independent of the genetic effects of educational attainment. The bars represent 95% confidence intervals. c Path diagrams providing the results of the standardised SEM models to investigate whether the SQ-R is genetically correlated with autism independent of the genetic effects of cognitive aptitude (CAg) and educational attainment (EAg). GWIS genome-wide inferred statistics, GSEM genomic structural equation modelling

