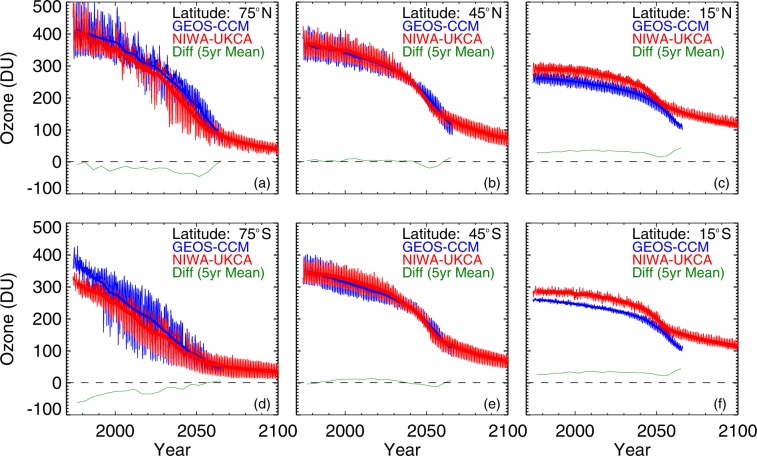
Figure 1.
Comparison between projected ozone values in the GEOS-CCM (blue lines) and NIWA UKCA (red lines) World Avoided models for high (a,d), mid (b,e), and low (c,f) latitudes. Thicker lines are 5-year running means. Green lines indicate the smoothed difference between the two models (i.e., NIWA-UKCA minus GEOS-CCM). Plots for latitude 15° are representative of all equatorial latitudes, while those for 75° are representative for higher polar latitudes.

