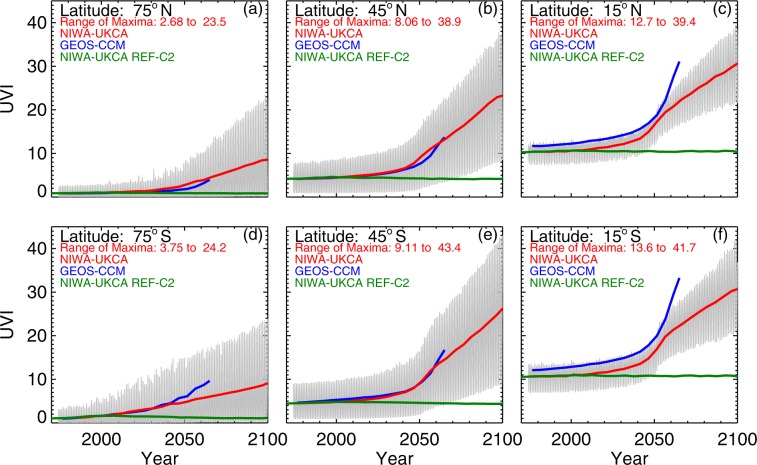
Figure 2.
UVI calculated from World Avoided and World Expected simulations for the period 1960 to 2100 for high (a,d), mid (b,e), and low (c,f) latitudes. The shaded area shows the seasonal range of predictions calculated from the NIWA-UKCA World Avoided simulation. The upper envelope of the shaded range refers to peak values predicted for the summer and the lower envelope to minimum values predicted for winter. The red and blue lines indicate the 5-year running means for the NIWA-UKCA and GEOS-CCM World Avoided model simulations, respectively. The green line is the 5-year running mean of the NIWA-UKCA World Expected simulation, which assumes full compliance with the Montreal Protocol.

