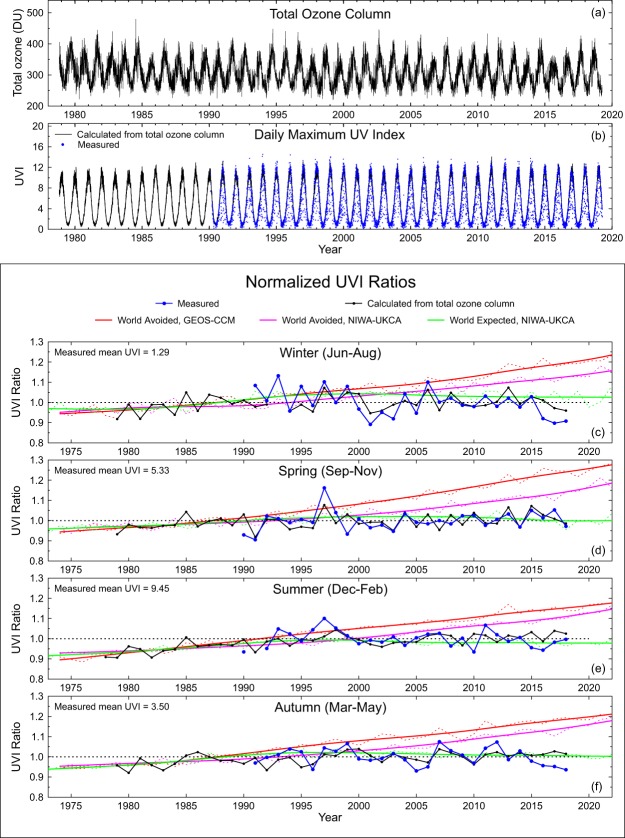
Figure 3.
Total ozone column (a) and daily maximum UVI within 1 hour of local noon (b) at Lauder. Panels (c–f) show UVI changes for winter (c), spring (d), summer (e) and autumn (f) determined from measurements of the NDACC instruments (blue), calculated from total ozone column (black), and projected by the two World Avoided (red and magenta) and World Expected (green) CCM model runs. UVI changes were normalized as described in the text and the “UVI ratios” shown in Panels (c–f) are ratios relative to these normalizations. Note that for the season that spans two years (summer at this southern hemisphere site), the year label refers to the year at the start of the season. For example, the summer of Dec 2017 to Feb 2018 is plotted at 2017.

