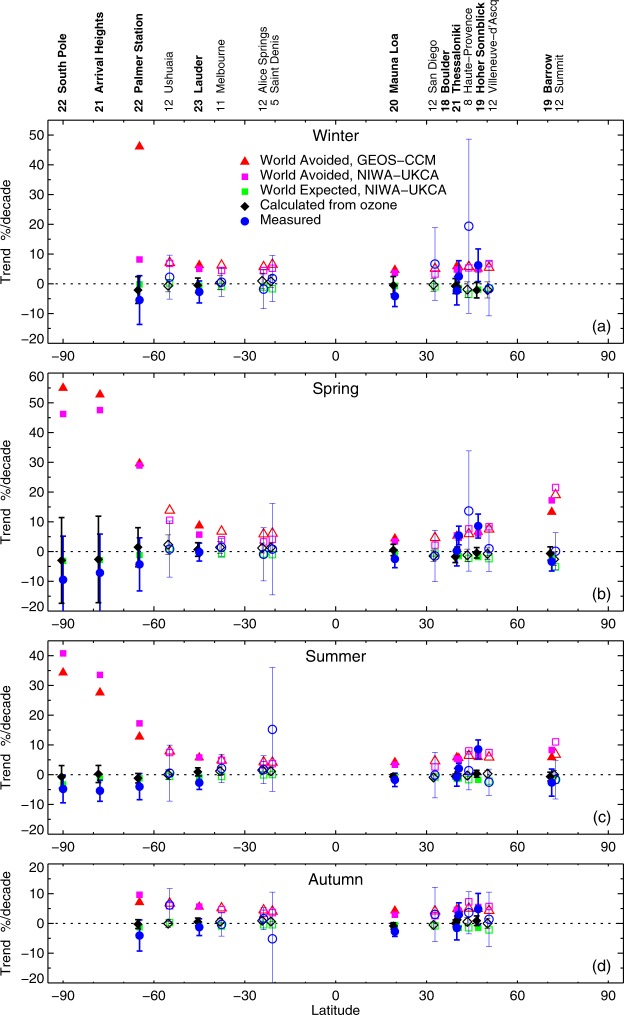
Figure 6.
Calculated decadal trends in measured UVI since 1996 (or from the data start year, if later than 1996) as a function of site latitude, compared with those calculated for clear skies from observed ozone, and as calculated by the two World Avoided model runs and the World Expected run for each season (a–d). Sites where the time series spans 20 years or more are denoted by bold text and solid symbols. The number of years of data included in the trend analysis at each site is indicated beside the site name. If data from some seasons are missing, this number can be less than the total number of years. Error bars shown are 2-σ uncertainties of the regression model.

