Figure 5.
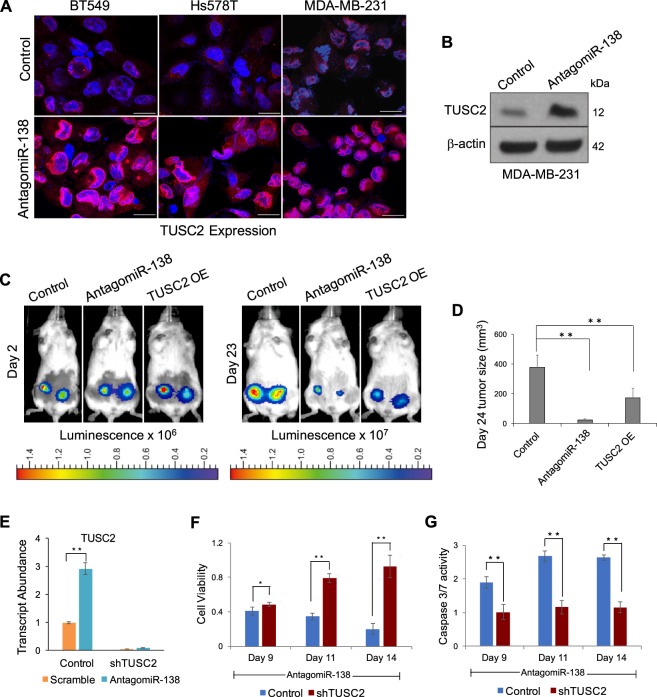
Over-expression of TUSC2 mimics the effects of miR-138 knockdown: (A) Immunocytochemistry images of cells following antagomiR-138 transduction scale bar-20 µm. TUSC2 protein is showed in red and nuclei are stained in blue. B) Western blot analysis of TUSC2 protein in MDA-MB-231 cell line transduced with indicated lentivirus. β-Actin serves as loading control. (C) Representative bioluminescent images of NSG mice implanted with antagomiR-138 expressing or TUSC2 overexpressing or control MDA-MB-231 cells, at indicated time points post engraftment in mammary fat pads. (D) Xenograft tumour sizes in mice on day 24 are represented as bar graph from indicated group (n = 10). (E) Histogram representing relative transcript abundance of TUSC2 upon miR-138 knockdown in MDA-MB-231 cells, which express control shRNA or shRNA against TUSC2. (F) Knockdown of TUSC2 rescues the proliferation defect induced by miR-138 knockdown. Control refers to miR-138 knockdown. (G) TUSC2 knockdown decreases caspase 3/7 activity and rescues miR-138 phenotype. Control refers to miR-138 knockdown. Error bars represent the standard deviation (Student’s t-test; *[P < 0.05], **[P < 0.01], ***[P < 0.001]).

