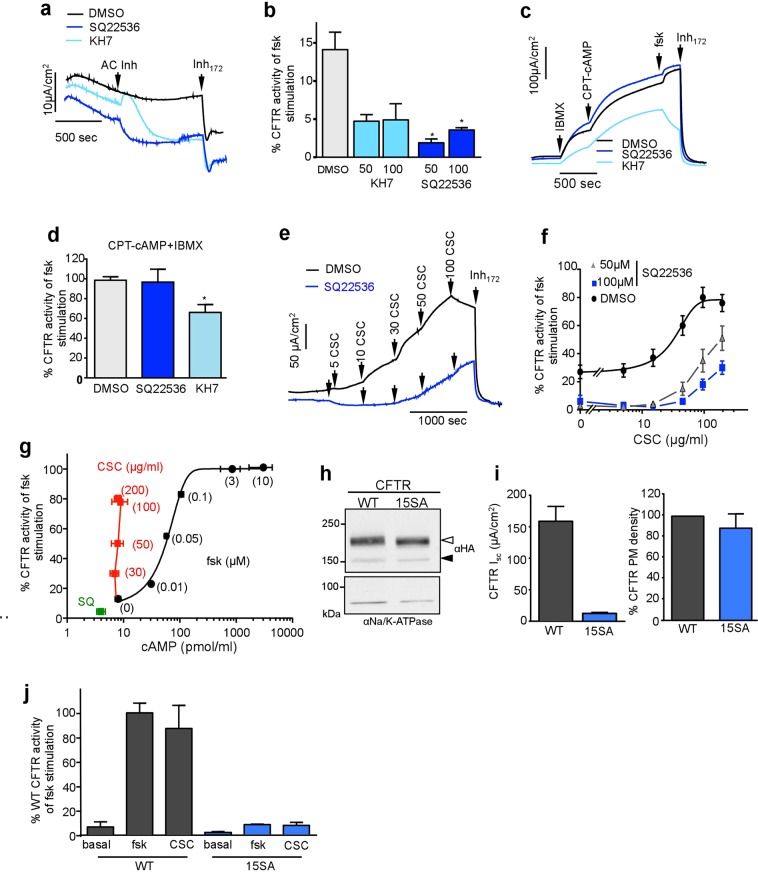
Figure 5.
CFTR activation by CSC depends on adenylyl cyclase activity and PKA phosphorylation but does not increase intracellular cAMP. (a) Representative Isc measurements depict the effect of 100 μM ACs inhibitors (KH7 and SQ22536) or DMSO on CFTR -mediated basal chloride current in WT-CFTR expressing CFBE. (b) Summary of ACs inhibitors (KH7 and SQ22536) effect on basal CFTR-mediated Isc calculated as the percentage of maximal current reached after maximal forskolin stimulation compared to the baseline after blocking CFTR with Inh172. Data are means ± SEM, n = 3–16 *p < 0.05 (c) CFTR-mediated Isc activation with the successive addition of phosphodiesterase inhibitor IBMX (200 μM), cell permeable cAMP agonist (CPT-cAMP; 500 μM) and forskolin (10 μM) on SQ22536 (100 μM), KH7 or DMSO pre-treated CFBE. (d) Summary of (c) Percentage of maximal current after CPT-cAMP and IBMX activation calculated as the percentage of maximal current reached after maximal forskolin stimulation compared to the baseline after Inh172. Data are means ± SEM, n = 3 *p < 0.05 (e) Representative Isc current of CSC titration on DMSO (black) or SQ22536 (100 μM) pre-treated (blue) in CFBE. (f) Summary of SQ22536 (50 and 100 μM) pre-treatment on CSC-triggered CFTR activation in CFBE. Data are means ± SEM, n = 3 with technical duplicates (g) cAMP level and Inh172-sensitive Isc in CFBE upon inhibition by SQ22536 (100 μM SQ, green) or stimulation by forskolin (0.01, 0.05, 0.1, 2 and 10 μM, black) or CSC (30, 50, 100 and 200 μg/ml red) measured with cAMP ELISA kit. Data are means ± SEM. n = 3(h) Immunoblot analysis of WT and 15SA PKA-phosphorylation deficient CFTR-3HA expression in CFBE. Complex- and core-glycosylated CFTR are indicated by an empty and filled arrowhead, respectively. Na/K ATPase was probed as a loading control. (i) 15SA mutations largely prevent the forskolin-induced CFTR activation. The WT and 15SA CFTR mediated Isc (left panel) and PM density (right panel) were measured in CFBE. Isc was measured in the presence of 20 μM forskolin. Data are means ± SEM, n = 3. Right panel: representative 15SA CFTR mediated Isc upon CSC and forskolin stimulation. (j) Summary of WT- and 15SA-mediated Isc current normalised for CFTR PM density and expressed as the percentage of forskolin-stimulated WT Isc after 10 μM forskolin stimulation. Note that proportionally reduced activation of the 15SA CFTR was detectable by CSC (200 μg/ml) Data are means ± SEM, n = 4.

