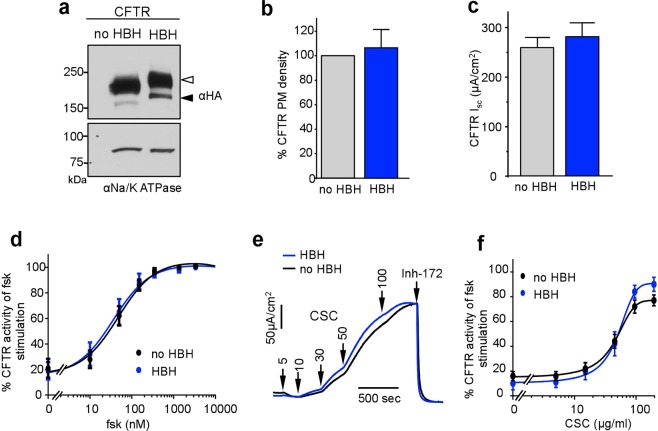
Figure 6.
Characterisation of HBH-CFTR-3HA expression and function. (a) Immunoblot analysis of CFTR-3HA and HBH-CFTR-3HA CFTR expression in CFBE. Complex- and core-glycosylated CFTR are indicated by an empty and filled arrowhead, respectively. Na/K ATPase was probed as a loading control. (b) PM densities of CFTR-3HA and HBH-CFTR-3HA were measured in CFBE with cell surface ELISA assay ECL detection. Data are means ± SEM, n = 3. (c) The CFTR-3HA- and HBH-CFTR-3HA-mediated Isc in the presence of 20 μM forskolin. (d) The summary figure of forskolin dose-response in WT-3HA and HBH-CFTR-3HA expressed in CFBE. Data are means ± SEM. n = 3 (e) Representative Isc recordings in WT-3HA- or HBH-CFTR-3HA- expressing CFBE. Arrows represent sequential addition of 5, 10, 30, 50, and 100 μg/ml CSC followed by addition of 20 μM Inh172. (f) Summary of (e) Dose response curve of CSC on Inh172-sensitive Isc in CFBE. Data represent means ± SEM, n = 3.

