Figure 3.
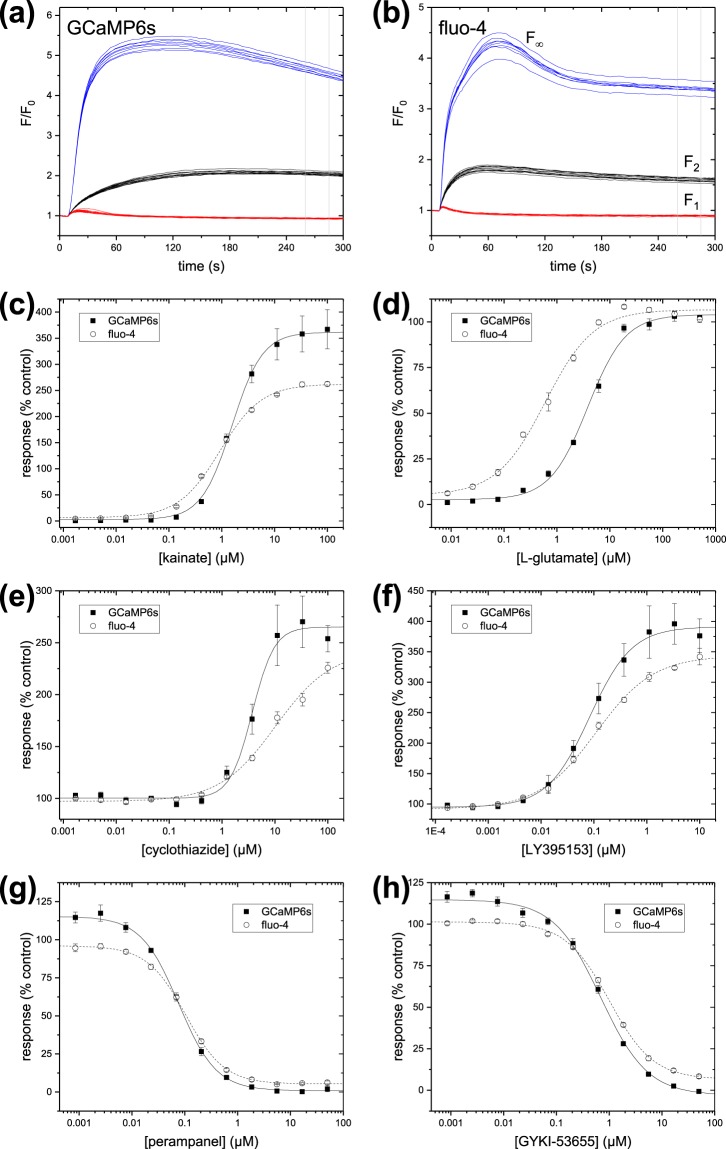
Comparison of intracellular calcium assays for stably-expressed GluA1o-γ4. Time-courses during stimulation with 15 µM glutamate for cells labelled with (a) stable expression of GCaMP6s and (b) fluo-4. Black lines indicate n = 12 negative control wells (0.5% DMSO only); blue lines indicate n = 8 control wells pre-incubated with a PAM (10 µM LY-395153); red lines indicate n = 12 positive control wells pre-incubated with an inhibitor (50 µM CP-465022). Vertical grey lines indicate the position of the measurement window. (c–h). Normalized response as a function of concentration of test compounds as indicated in the legends. Data are expressed as mean and standard deviation of all individual data points from three separate experiments. Lines are Hill function fits to the data.

