Figure 4.
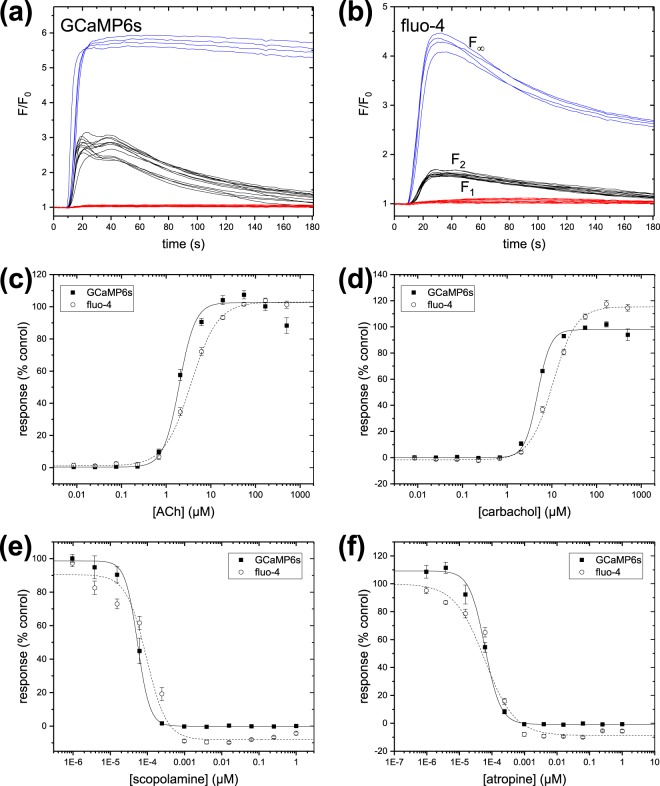
Comparison of intracellular calcium assays for the endogenous muscarinic receptor expressed in 293-F cells. Time-courses during stimulation with 30 nM ACh for cells labelled with (a) stable expression of GCaMP6s and (b) the synthetic indicator fluo-4. Black lines indicate n = 12 negative control wells (0.5% DMSO only); blue lines indicate n = 4 control wells treated with 10 µM ionomycin; red lines indicate n = 12 positive control wells pre-incubated with an inhibitor (1 µM scopolamine). (c,d) Normalized response as a function of concentration of selected antagonists. (e,f) Normalized response as a function of concentration of selected agonists. Data are expressed as mean and standard deviation of all individual data points from three separate experiments. Lines are Hill function fits to the data.

