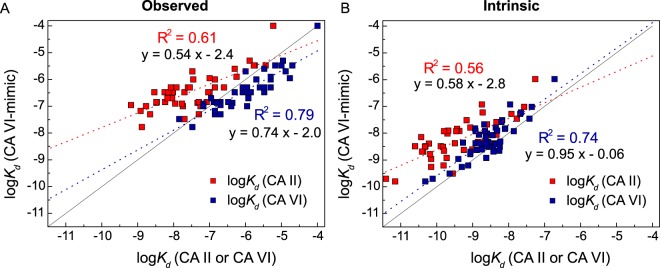
Figure 5.
Comparison of logKd values representing observed (A) and intrinsic (B) inhibitor binding affinities towards CA VI-mimic and CA II (red squares) or CA VI-mimic and CA VI (blue squares). Straight line represents a model of equal affinity of inhibitor binding to pairwise proteins. Red and blue dashed lines show linear regression models for inhibitor binding to CA II and CA VI, respectively. R2 values and linear equations are indicated. Experiments were performed by FTSA (pH 7.0, 37 °C).

