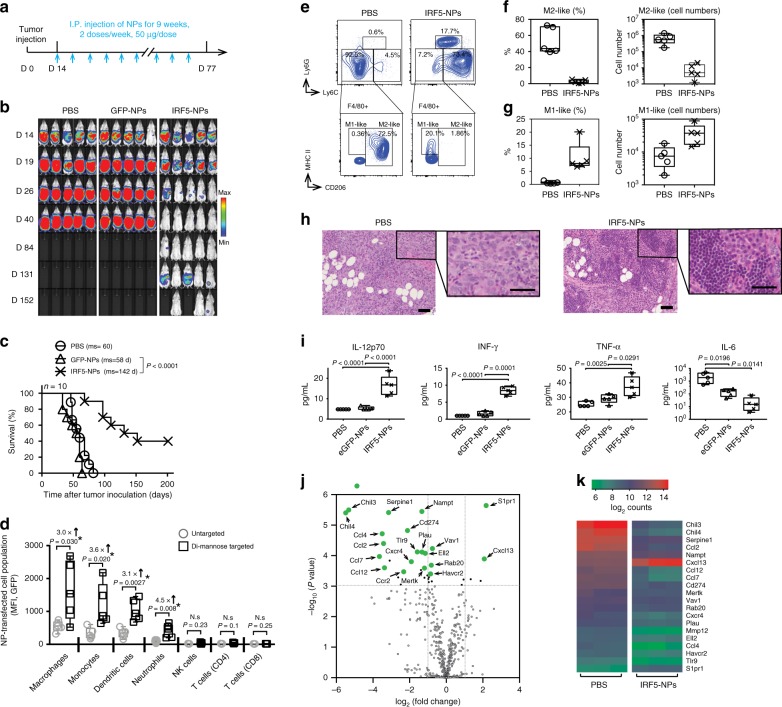
Fig. 4.
IRF5/IKKβ mRNA nanoparticles double survival of mice with ovarian cancer. a Time lines and dosing regimens. b Sequential bioluminescence imaging of tumor growth. c Kaplan–Meier survival curves. Statistical analysis was performed using the log-rank test. N = 10 biologically independent animals. d Flow cytometric quantitation of in vivo transfection rates in different immune cell subpopulations 48 h after a single i.p. dose of untargeted versus Di-mannose-coated NPs carrying GFP mRNA: macrophages (CD45+, CD11b+, MHCII+, CD11c-, Ly6C-/low, Ly6G-), monocytes (CD45+, CD11b+, MHCII+, CD11c-, Ly6C+, Ly6G-), dendritic cells (CD45+, CD11c+, CD11b-, MHCII+), neutrophils (CD45+, CD11b+, MHCII+, CD11c-, Ly6G+), CD4+ T cells (CD45+, TCR-β chain+, CD4+, CD8-), CD8+ T cells (CD45+, TCR-β chain+, CD4-, CD8+), and natural killer cells (CD45+, TCR-β chain-, CD49b+) were measured. e Flow cytometric analysis of macrophage phenotypes in the peritoneum of mice with disseminated ID8 ovarian cancer. Animals were either treated with 4 doses of IRF5/IKKβ NPs or PBS. f Box plots summarizing relative percent (left panel) and absolute numbers (right panel) of Ly6C-, F4/80+, and CD206+ (M2-like) macrophages. Corresponding numbers for Ly6C-, F4/80+, and CD206- (M1-like) macrophages are shown in (g). h Representative hematoxylin and eosin (H&E)-stained sections of ovarian tumor-infiltrated mesenteries isolated from PBS controls (left panel) or IRF5/IKKβ NP-treated animals (right panel; scale bar 100 µm). Tenfold magnifications of representative malignant lesions are shown on the right (scale bar 50 µm). i Luminex assay measuring cytokines produced by isolated peritoneal macrophages from each treatment group. In parallel experiments, FACS-sorted CD11b+, F4/80+ peritoneal macrophages were directly analyzed by NanoString gene expression analysis. j Results are depicted as a Volcano plot. k Heat map of signature gene expression in macrophages isolated from mice treated with IRF5-NPs versus control PBS. All boxes in boxplots in this figure represent the mean values and the line in the box represents median. The bars across the boxes show the minimum and maximum values. Whiskers represent 95% confidence intervals. N = 5 biologically independent samples

