Fig. 1.
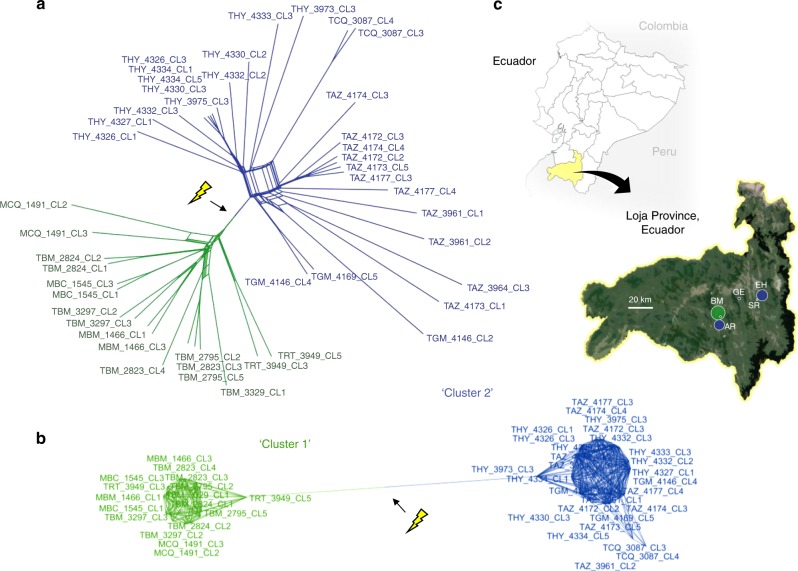
Phylogenomic relationships among T. cruzi I clones from southern Ecuador. a Data are represented as a split network by the Neighbor-Net algorithm68. Pairwise genetic distances are defined as the proportion of non-shared genotypes across all biallelic SNP sites for which genotypes are called in >40 individuals (n = 68,449). Arrow (and flash) indicate a strong, unambiguous break in gene-flow between two reticulate assemblages, Cluster 1 (green) and Cluster 2 (blue). Though non-treelike phylogenetic models are better suited to the data, a maximum-likelihood tree is also provided for comparison in Supplementary Fig. 1. b A minimum-spanning network80 further illustrates the genetic disconnectivity between Clusters 1 and 2. Multi-furcating nodes are arranged such that cumulative edge distance is minimized among samples. Pairwise genetic distances are haplotype-based, defined as the proportion of non-shared alleles across all SNP sites for which genotypes are called for all individuals (n = 7,392). c Sampling regions in Loja Province, Ecuador, are abbreviated as BM Bella Maria, AR Ardanza, EH El Huayco, SR Santa Rita, and GE Gerinoma. Point sizes correspond to sample sizes and colors correspond to cluster membership (see phylogenetic networks). The upper map is adapted from https://d-maps.com/carte.php?num_car=3400&lang=en (d-maps.com). The close-up uses Landsat imagery courtesy of the U.S. Geological Survey

