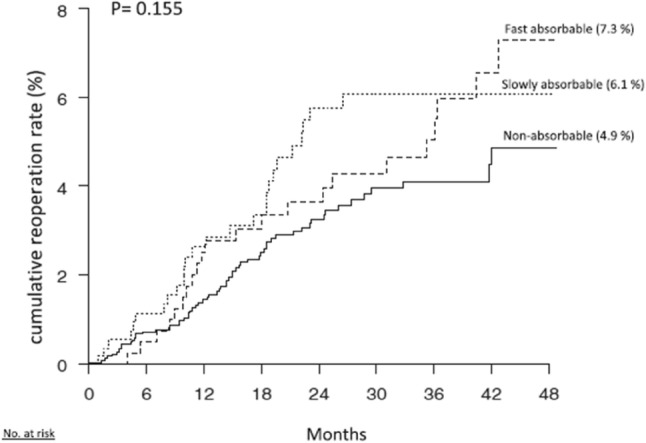
Fig. 1.

B Kaplan–Meier plot illustrating the cumulated risk of reoperation for recurrences for the three different suture types in the sutured repair group (log rank, p = 0.155)

B Kaplan–Meier plot illustrating the cumulated risk of reoperation for recurrences for the three different suture types in the sutured repair group (log rank, p = 0.155)