FIGURE 6.

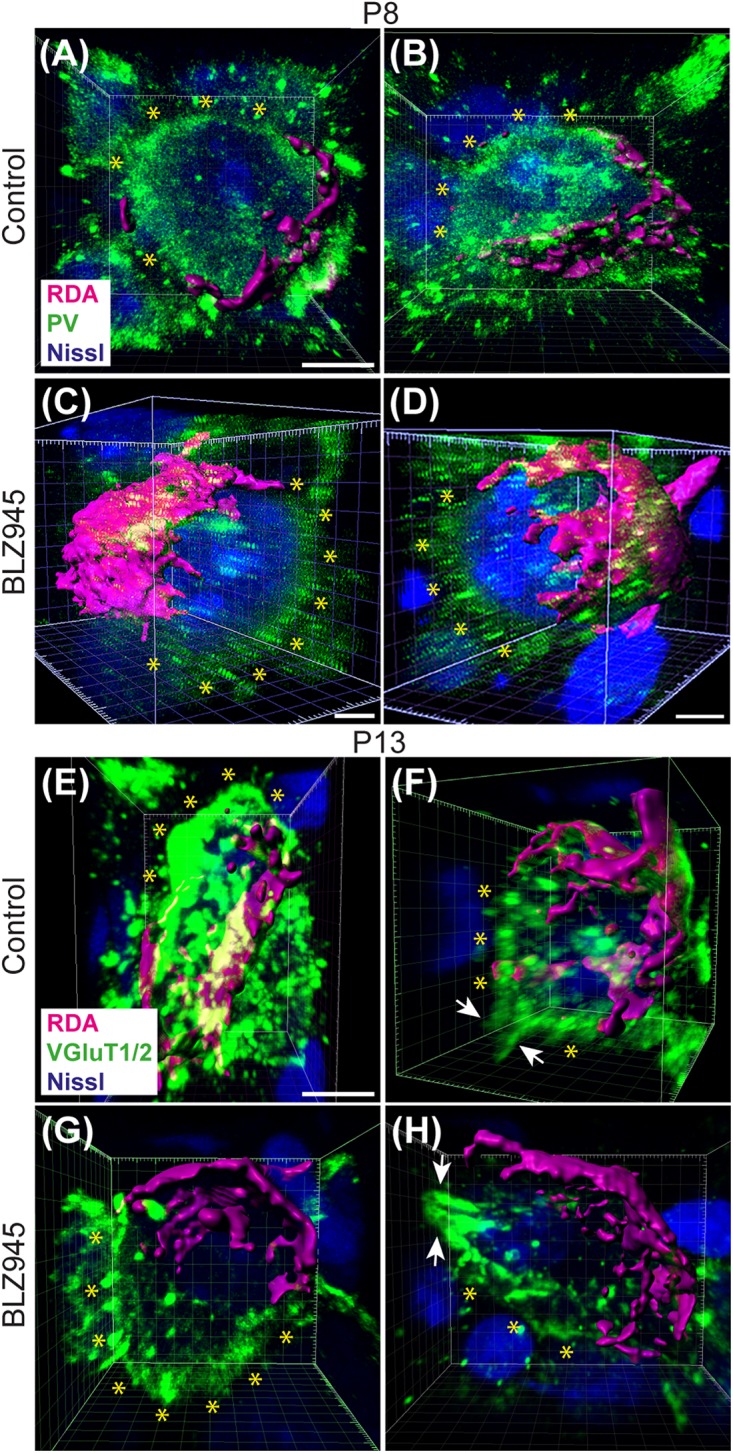
Confocal analysis of polyinnervated neurons in the presence or absence of microglia. (A,B) Images showing reconstructed RDA-labeled calyces of Held (magenta) terminating on MNTB principal neurons in control mice at P8. Both are examples of polyinnervated MNTB neurons as evidenced by RDA-labeled calyces and additional PV (green) labeling (asterisks) outside of RDA-labeled calyces. (C,D) Examples of polyinnervated neurons in BLZ945-treated mice at P8. (E,F) Examples of polyinnervated neurons in control mice at P13. Asterisks indicate VGluT1/2 labeling on neurons in addition to RDA-filled calyces of Held. (G,H) Images of polyinnervated neurons in BLZ945-treated mice at P13. Scale bar in panel (A) = 3 μm, applies to panels (A,B). Scale bar in panels (C,D) = 3 μm. Scale bar in panel (E) = 3 μm, applies to panels (E–H).
