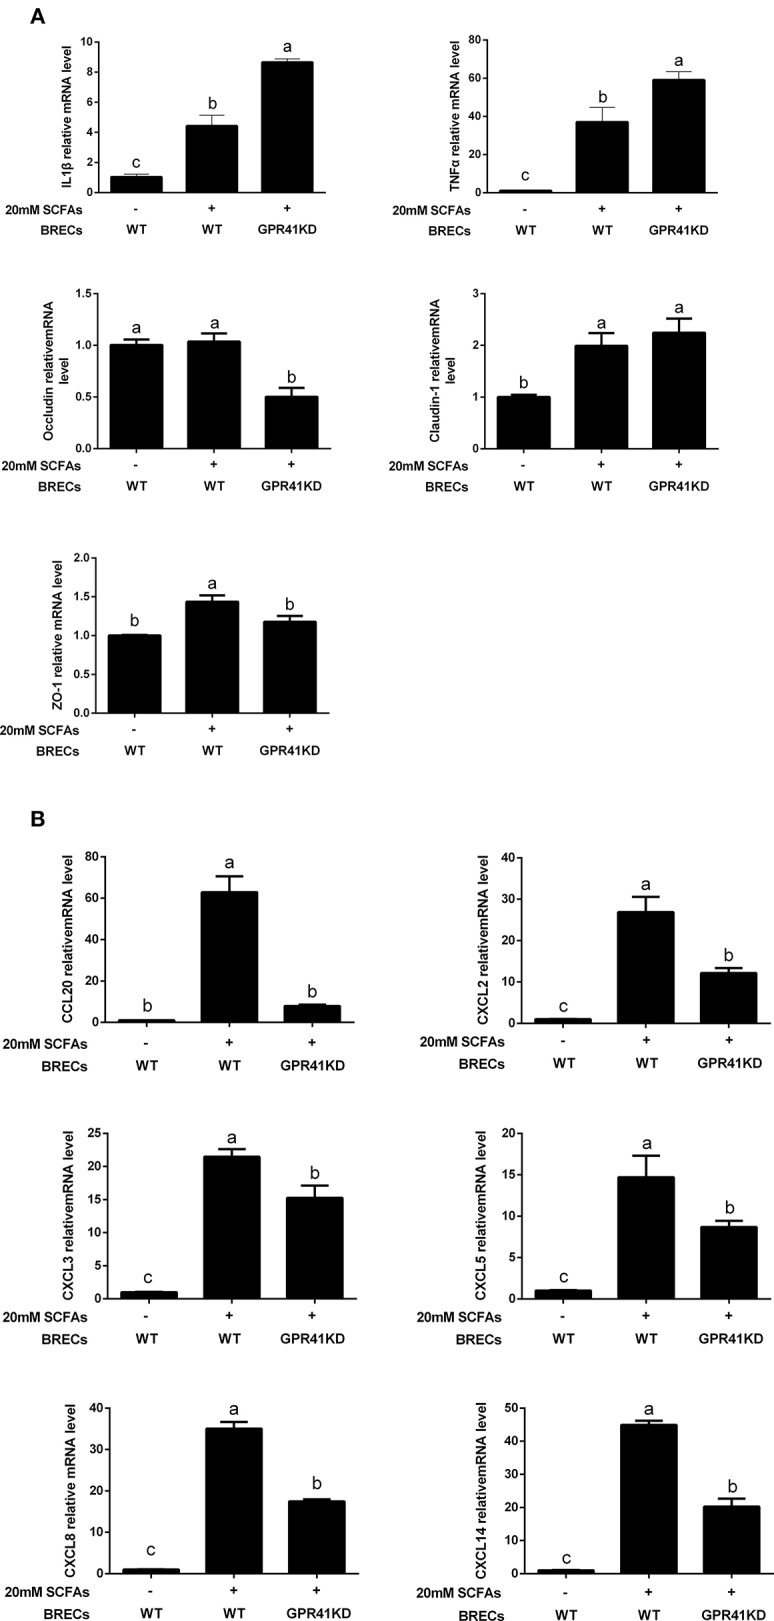
Figure 4.

Quantitative real-time polymerase chain reaction analysis of selected genes. All of the data were obtained at 24 h from untreated BRECs or 20 mM SCFAs treated BRECs or 20 mM SCFAs treated GPR41KD BRECs. qRT-PCR analysis of IL1β, TNFα, occludin, claudin-1, ZO-1 (A), CCL20, CXCL2, CXCL3, CXCL5, CXCL8, and CXCL14 (B) expression levels. GAPDH was used as an internal reference gene. Different lowercase letters indicate significant differences. Data shown are means ± SEM of three independent experiments (n = 3). WT, Wild type.
