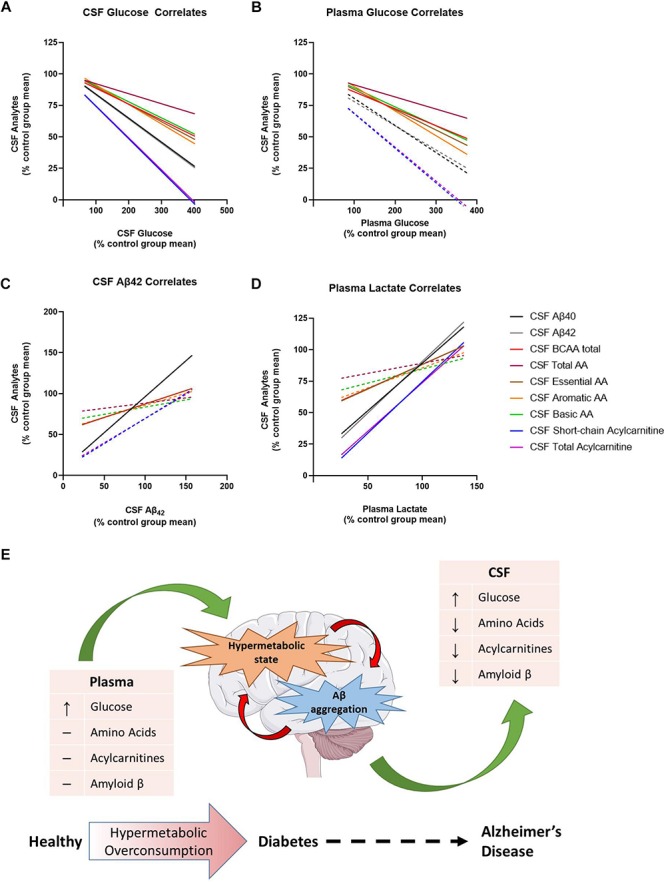
FIGURE 4.

Metabolic dysregulation is associated with changes in plasma lactate, cerebrospinal fluid (CSF) glucose, and CSF Aβ40 and Aβ42. Here, each data point has been converted into a value that represents the % of the control group’s mean [value = 100∗(x/control group mean)]. (A) Normalized CSF glucose values were negatively correlated with several normalized CSF analytes. (B) Normalized plasma glucose were negatively correlated with normalized CSF amino acids, but not normalized CSF Aβ40, Aβ42, or acylcarnitines. (C) Normalized CSF Aβ42 was correlated with normalized CSF analytes. (D) Normalized plasma lactate values were positively correlated with several normalized CSF analytes. (E) Thus, the model we propose here is that type 2 diabetes (T2D) moves the brain into a state of hypermetabolic overconsumption wherein the brain consumes increased energy, leading to lower concentrations of Aβ42 in the CSF, which is indicative of increased Aβ aggregation. Lines represent non-linear regression best fit curve; solid lines indicate statistical significance.
