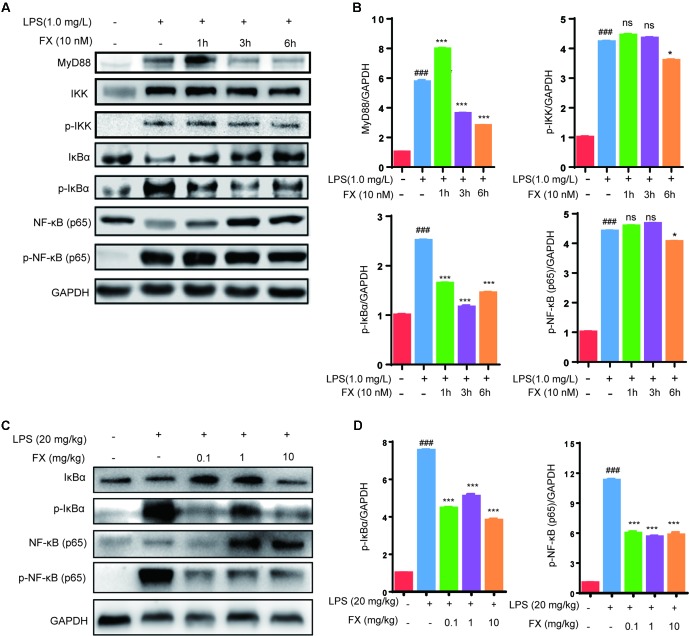
Figure 7.
Effects of FX on NF-Κb signaling in LPS-treated RAW264.7 cells and LPS-treated mice. (A) Western blot analyses were performed to detect the levels of MyD88, IKK,p-IKK, IκBα, p-IκBα, NF-κB (p65), and p-NF-κB (p65) in LPS (1.0 mg/L)-treated RAW264.7 cells; (C) Protein levels of IκBα, p-IκBα, NF-κB (p65) and p-NF-κB (p65) in liver homogenates were evaluated by western blot analysis after LPS (20 mg/kg) challenge 6 h with or without FX treatment. (B and D) Densitometric analysis of the relevant bands was performed. The data were analyzed by the one-way ANOVA, followed by Tukey’s post hoc test. (###) p < 0.001, significantly different when compared with that of the control group. (∗) p < 0.05 and (∗∗∗) p < 0.001, significantly different when compared with that of the LPS group, ns: not significant. The data are representative of three independent experiments.

