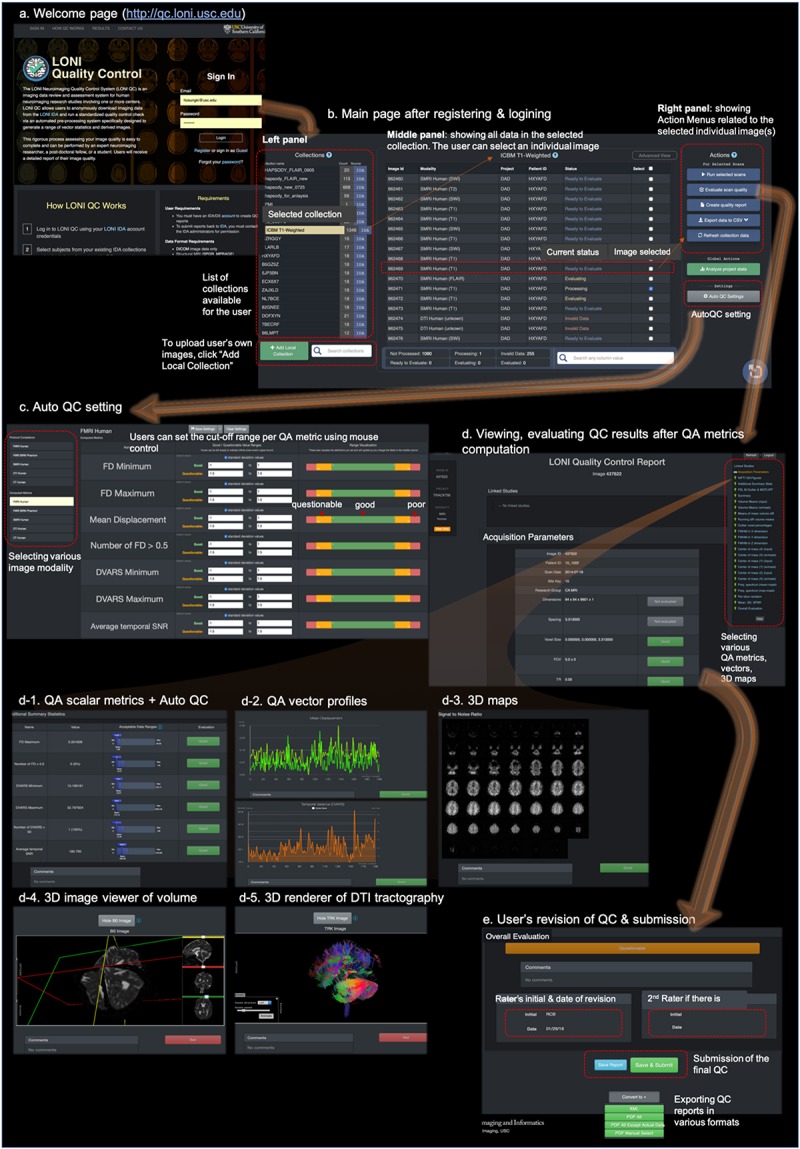
FIGURE 2.

The web-based user-friendly GUI for LONI QC system. (a) Entering to http://qc.loni.usc.edu using any web-browser, users can register their accounts and log in to LONI QC system. (b) After sign-in, users enter into the main page. In the left panel the user can first select a data collection. The user can select image(s) in the selected collection in the middle panel. Finally, in the left panel, the user can select an Action related to the selected image(s): either run new QC, evaluate QC result, create QC report, export QC data to a CSV file or refresh collection data. (c) The user can set or change the cutoff values/ranges in ‘auto QC setting.’ The cutoff ranges are set per image modality by selecting it on the left-bottom panel. The ranges can be compared to the mean and SD of the previously processed datasets. (d) Once QC metrics computation were completed and the user clicked “Evaluate scan quality” in the left panel of the main page, the user can appreciate and evaluate the calculated QC metrics (d-1), vectors (d-2), and 3D maps and renderings (d-3,4,5) per image. If the auto QC was performed, they can find the ‘good,’ ‘questionable’ or ‘bad’ flags and can revise the results if they do not agree. After the evaluation and revision of QC, users can submit the final evaluation to the system and request to export the QC reports in various formats such as XML or PDF (e).
