Figure 5.
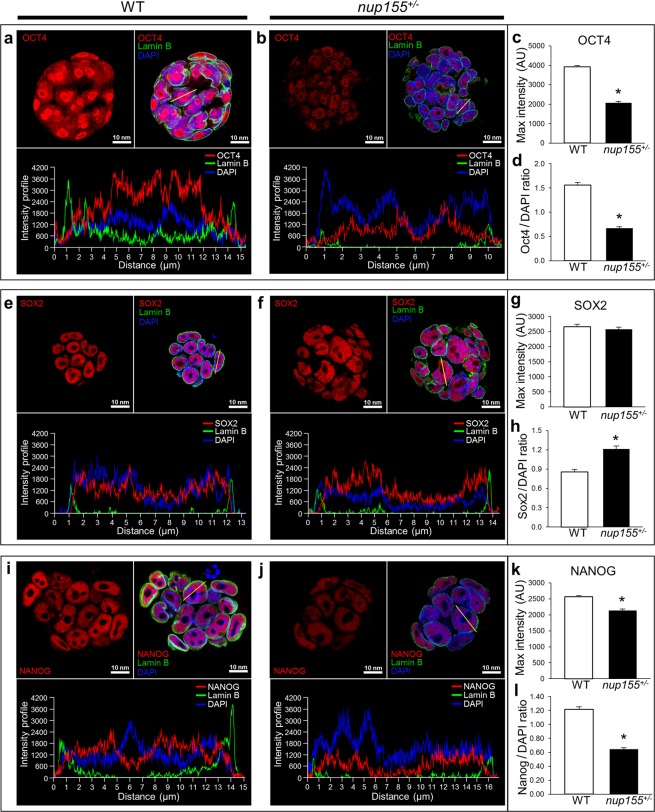
Expression of pluripotency factors is decreased in nup155 deficient ESCs. (a,b) Representative images of OCT4 (red), Lamin B (green), and DAPI (blue) fluorescence signal depicting OCT4 intranuclear localization with overall decrease in signal profile in nup155+/− (right panel) compared to ESC colonies. Bottom panel represents individual cell intensity profiles. (c,d) Maximum (Max) intensity of OCT4 in nup155+/− ESC colonies was significantly decreased compared to WT, along with the OCT4:DAPI signal ratio (*p < 0.001). (e,f) SOX2 (red), Lamin B (green), and DAPI (blue) triple staining of nup155+/− and WT ESC colonies show no overall change in intranuclear signal profile, as well as (g) no change in SOX2 max signal intensities between conditions (p = 0.42). (h) SOX2:DAPI signal ratio is higher in NUP155 deficient cells compared to WT. (i,j) NANOG (red) fluorescent signal profile was diminished in nup155+/− compared to WT. (k,l) NANOG (red) max intensity and NANOG:DAPI ratio were significantly decreased in nup155+/− ESC colonies compared to WT (*p < 0.001).

