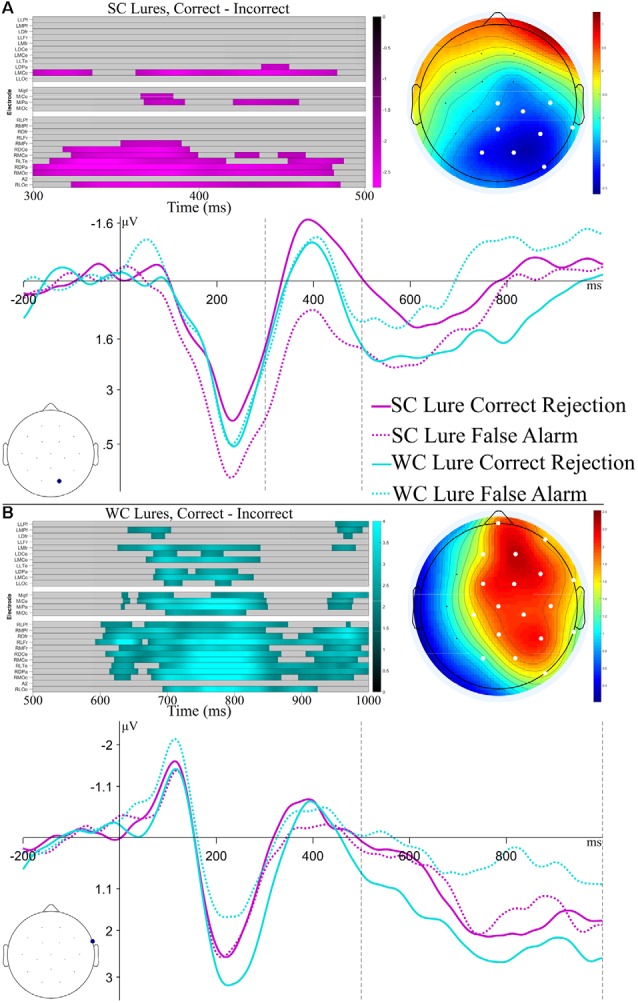
Figure 5.

Results and ERP plots for analyses of Lures. The top half (A) focuses on Strong Constraint Lures, with a time window of 300–500 ms, whereas the bottom half (B) focuses on Weak Constraint Lures, with a time window of 500–1,000 ms. The raster plots show channels and time-points which make up the significant cluster found in the permutation tests. Colors represent the t-value at the time-point. The ERP topography plots show the mean amplitude in the time window of the significant cluster, with significant channels highlighted in white. The ERP plots show the SC and WC Lures at the maximal channel within the observed cluster. The black dashed lines indicate the time range of the permutation tests.
